Our office has been handling more appeals lately, and I am learning the rhythm of the process a little better each day. Appeals seem to go like this: (1) you lose or win at trial and feel really emotional about it, (2) you file your appeal or get noticed that someone filed one on you, and (3) you wait until you don’t feel anything at all anymore. Somewhere in there you file a brief. Then you wait some more and file other briefs. Sometimes a court reporter loses your transcripts and tells you your trial never happened. That can rouse some feelings, but they pass. Because mostly you just wait.
And while you’re waiting, everyone is constantly asking you how much longer they’ll have to wait. I haven’t yet mastered delivering earnest but vague statements of reassurance, such as “waiting is good because it means you haven’t lost yet.” I’ve heard that’s what appellate lawyers do. The people waiting don’t think waiting is good, because it means they haven’t won yet either.
I wanted a real answer to the question how much longer? I looked all over the internet. There were reports (cited below) on dependency and TPR apppeals from 2010 and 2015, but no follow-ups or ongoing data on whether those reforms were successful. There were also lengthy reports on trial court clearance statistics. There was nothing (that I could find) on the district courts. So I decided to create something.
But first, an answer to How long do I have to wait on my appeal?
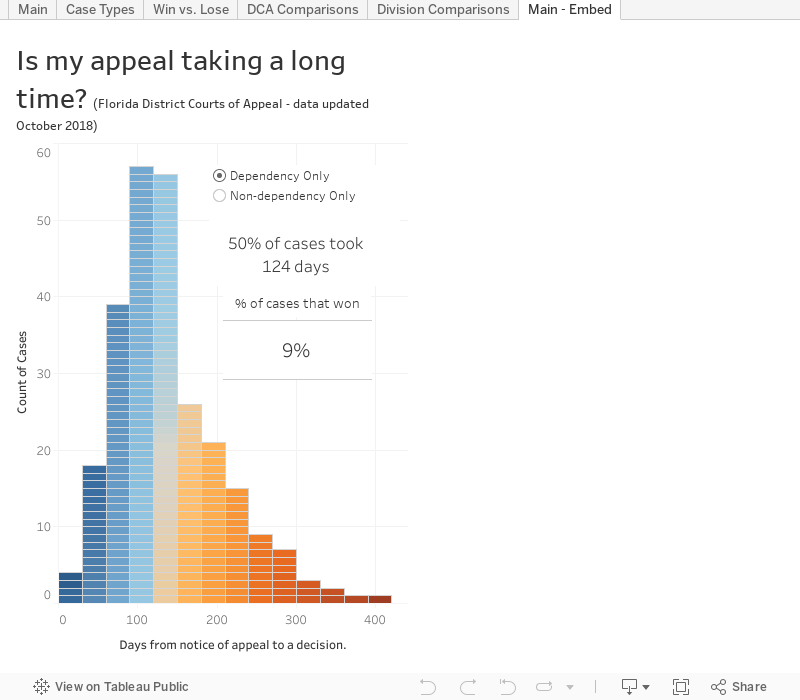
Probably at least 122 days for a dependency or TPR case.
Probably at least 293 days for anything else.
Probably a little longer if your case is in the Second DCA.
There. Quit asking.
I put it all in a tableau so you can play with it.
The details are really interesting, if you’re into numbers. I put it all into a tableau, a quick version of which should appear here:
A full version with more stats is available here. (You can also use the link if the embedded tableau above didn’t show.) The full version breaks things down by DCA, case type, wins and losses, and originating divisions. I will commit to updating it for a few months to test for stability. I can’t promise after that.
The process – also, why didn’t this already exist?
My plan was basically to dive in, coming up for air every now and then to run the same “florida district court statistics” google search to see if I missed something. If anyone wants to recreate (or check) my work, here’s how it went.
Step 1 to finding an answer was to see what information I even had access to. All of the DCAs report their opinions on their websites. Three of them use a searchable system that creates spreadsheets by month. Two publish weekly text lists that you have to go through on your own. All of the DCAs use an online docket system that has a very convenient URL interface for going right to the case you want, unless that case is a dependency case.
Step 2 was figuring out how many cases they’re even putting out. My curiosity knows no bounds, but my actual time to spend on this was limited to a week or so. The answer was about 200 cases per month per DCA. That wasn’t bad. I planned to do a 10% sample of three months anyway, so 60 cases per DCA felt reasonable.
Step 3 was dealing with the fact that dependency cases are restricted from the public, so they are not available on the online docket system. Instead, I had to look them up on Westlaw and pull out their appellate case numbers and the outcomes. Fortunately, all of the DCAs use a linear case numbering system (for example 15-001 was filed earlier than 15-055 in the year 2015). Once I had case numbers and filing dates of known cases, I could interpolate the dependency filing dates to within a few days. That was good enough for these purposes.
Step 4 was pulling all of the data on 459 cases and punching it into a spreadsheet. I then crunched some probabilities, ran some ANOVAs, generated a few survival reports, and made some tableaus based on what was statistically relevant. Some people have other hobbies, I guess.
What I could tell you about appellate cases would not fill a book
The sample size of three months was enough to get a big picture number, but not enough to do a lot of fine parsing of the data. As I add months in the future, maybe things will stand out. In the meantime, here is what I can say with a reasonable amount of confidence.
More people won than I expected, but still not that many. About 11% of the cases were “wins.” I defined win very broadly to include anything that wasn’t a straight affirmance or dismissal of a petition.
The DCAs were surprisingly similar. I was concerned that a 10% sample would result in garbage. It didn’t. All of the samples were roughly normal. The 1st, 3rd, 4th, and 5th all had numbers that were statistically indistinguishable. (A bigger dataset may eventually tease them apart, but this one didn’t.) Only the 2nd DCA stood out as statistically higher than the rest. For example, the 2nd DCA processed half of its cases in 282 days (+/- 18), while the statewide average was 208 days (+/- 11).
Below is a survival graph. Imagine the top left corner as the starting line, and each district racing to the bottom. The cumulative survival of 1.0 equals 100% of cases still open (“surviving”), and 0.4 would equal 40% of cases still open. The first to the bottom (measured in days across the bottom) is the fastest. As you can see below, four of the DCAs reach the bottom at about the same time. The 2nd DCA stands out as statistically different, in large part because it was slower off the line and struggled with its last 20% of cases compared to other districts.

There wasn’t much variation among the types of cases, except for dependency. The average of 208 days also applied to case types, but dependency stood out as significantly faster. It took the DCAs only 121 days (+/- 2) to process half of their dependency cases. Civil and criminal were indistinguishable in this dataset, though more info later may tease them out as well. There weren’t enough probate, worker’s comp, family, or administrative appeals to say much about them individually yet.
You can see below that dependency cases resolved much faster than anything else. Civil, criminal, and family are pretty consistent in the middle. (Civil starts out slower, but eventually catches up to criminal.) The jaggy curves are probate and worker’s comp cases, which only had a few examples of each.

There was no measurable difference between writs and appeals. Again, a larger dataset may tease out a difference, but the line for writs and appeals were indistinguishable in this one.

Dependency “wins” follow the curve, but exaggerate it a little. Again again, there aren’t that many dependency wins either. But in this dataset at least, they tended to come out faster at first, then move closer to the win curve above after a case has already taken about 150 days. This is a slight exaggeration of the full win curve above, which also flips somewhere around 150 days.

You can’t predict a win based solely on amount of time open. Again, I want to stress that there are very few wins in general (11%) and they are scattered across the timeline. Knowing that an appeal has been open for 600 days doesn’t tell you much about its eventual outcome because the last 10% of the “loss” line accounts for far more cases than the last 10% of the “win” line.

Even though wins are a little faster or slower as a group, you can only know that after you know the outcome of the case. I ran the numbers — if you only know how many days the appeal took, you can predict a win with 5% accuracy. Adding in the DCA, appeal type, and division only gets you to 11% accuracy. That’s worse than guessing.
The takeaway
The good news is that this data supports a claim that the Court’s previous efforts (below) to speed up dependency appeals actually worked. Only time will tell if that is a stable finding or if I just happened to look at a particularly fast few months. Stay tuned.
More info on the appellate courts
Recommendations for Dependency and Termination of Parental Rights Appeals (Florida Supreme Court – Commission on District and Trial Court Performance & Accountability – April 2016)
A Review of the Florida District Courts of Appeal Boundaries and Workload (OPPAGA – February 2017)
Examining the Work of State Courts: An analysis of 2010 state court caseloads (Court Statistics Project – December 2012)
Clearance Rate Dashboards (flcourts.org – September 2009 to present)
Leave a Reply