The Guardian ad Litem Program started as a scrappy community of advocates and gadflies who sought to bring attention and change to the dependency system. It is now a state agency that’s been appropriated over $600 million in the last 15 years. There has never been a comprehensive study to determine whether the Program accomplishes its goal of improving the lives of foster children. I looked at the Program’s performance numbers, first out of irritation, then curiosity, and ultimately the realization that we need more fact-based information about the “Second DCF” to answer the core questions surrounding its continued funding and structure. The questions explored here are whether the GAL Program is ethical, effective, and good for children? The answer to all three questions, it turns out, is the same.
An email spurred me to start working on this post. I thought we were past the days when GAL Program leadership and their friends accused children’s attorneys of wanting kids to die. And yet here we are. I got this letter in my inbox a few weeks ago from GAL:

That email made me very sad. I worked at the Guardian ad Litem Program and I love the people there. I got started blogging in child welfare through defending the Program against unfair criticism and I still defend them when the criticism is unfair. I will do it again in this post, when appropriate. I have always answered GAL’s calls, accepted referrals for their kids, spoken at their events, and participated in their trainings. Yet, it’s getting harder to ignore the messaging coming out of its Tallahassee office. The accusation that representing kids means blindly throwing babies into unsafe situations is nothing new. I am still sad, though, because I know the people who wrote this letter know better.
I understand that people may not understand how direct representation of kids works in Florida, since it is the minority model here. What is described above is not it. I will briefly explain.
Client-direct child representation, in a nutshell
Let’s take the situation described in the letter where the parent’s home is unsafe and the child wants to go back. This describes almost every case where a child is removed — and the law says we’re supposed to try reunification first. In the best interest model, the GAL investigates the situation and comes up with a position. If the GAL decides that reunification is not their preferred path, then the GAL attorney makes no further efforts and waits for the parent to fail. Alternatively, a GAL could actively thwart the family’s efforts at reunification by filing motions to limit visitation or to pile on extra services.
In the direct representation model, on the other hand, we start with the position of the child. If the child wants to pursue reunification, then the attorney must take steps to try to make reunification possible. The law requires the home to be safe, so the attorney aims to make it so. That could include seeking services for the parents, holding the Department accountable if it doesn’t make reasonable efforts, filing injunctions to get abusive people out of the home, and a lot of other efforts to try to meet the legal standard. The client-directed attorney must also communicate with her child client and counsel her about the likelihood of success and other options. Maybe the child changes her mind about going home at some point; maybe the parent is never able to create a safe home. The client-directed attorney may never achieve the client’s goal and reunification may never happen.
The difference in the two models is that the directed attorney’s efforts are proportional to the child’s desire to go home, while the best interest advocate’s efforts are proportional to their own value system and beliefs (which none of the other parties or even the judge has any way of really exploring). The attorney providing direct representation to a child cannot lie to a judge, withhold information on known harms in a way that is tantamount to fraud on the court, or pick up children and throw them into burning houses. If a child’s attorney does any of that, please report them to the Bar.
So what happened that we’re even talking about this?
The email above mentions a request for an ethics opinion from a Florida Bar special committee. The committee was looking at legal representation in the child welfare system. I wasn’t on the committee, but I was part of a community of advocates who thought the committee was a good idea. There is a growing national movement around empowering parents’ and kids’ attorneys to strongly advocate to overcome the legal and social factors that drive up child maltreatment rates. To me, this committee was a step toward bringing that discussion to Florida. Knowing Florida, though, I doubt it even got close to that topic without devolving into exactly the nonsense that this whole post is about.
I’ve heard that the question of children’s representation came up frequently during those meetings. I’ve also been told that the GAL Program somehow wound up presenting on its model of representation and how it advocates for kids. I’ve seen the GAL powerpoint from that presentation and it seemed relatively straightforward. Apparently what was said during the presentation was not so clear.
I don’t know the intended goal of the GAL Program’s presentation to the committee, but multiple sources have told me it did more harm than good. People with no strong feelings about the GAL Program walked away from the presentation scratching their heads over what exactly is going on there. The email above from its leadership doesn’t say “sorry we botched it,” but that appears to be, in part, what happened. When the Florida Bar president is quoted as saying, “How could [an investigation] hurt?” that suggests the public education campaign didn’t go well.
The email above is meant to mobilize GAL volunteers to reach out to powerful people they are connected to. It lays out the talking points, and I suppose that’s good self-advocacy. The email includes a link to the proponent’s letter, but does not attempt to explain the situation or even defend the Program’s acts that the letter raises questions of. I’m going to try to explain and hope I get close enough.
Is the GAL Program Ethically Using Its Attorneys?
The special committee raised two main issues with the way the GAL Program uses its attorneys. Despite the tone of indignation in the GAL Program letter, the issues are what anyone employing in-house counsel should consider when setting up an office irrespective of whether that office is in a private corporation or a government agency. The questions require rational and objective application of the legal ethical rule that covers lawyers who represent organizations: Florida Rule of Professional Conduct 4-1.13. Also, despite the doomsday rhetoric, I don’t find the resolution of either question particularly fatal to the working of the GAL Program. In fact, I think the problem is the Program’s marketing, not its structure.
The first question revolves around who the attorney takes direction from in the Program. Organizations are required to designate a person or group of people to direct the attorney’s work. This person or group is called the “constituent.” The GAL Program, as stated in their powerpoint, has designated a three-person team: the staff or volunteer GAL, the Child Advocacy Manager, and the CBI Attorney. That last part is the potential problem — the attorney can’t also be the constituent. It’s an easy fix – just clarify that the attorney counsels and takes direction from the GAL and CAM. Then add that all attorneys directly report to a supervising attorney. It’s more or less what the powerpoint already says, so done and done.
Unfortunately, the Program doesn’t seem to want to do that because of the second issue. Apparently, the GAL folks were dead set on making the case that the GAL Program, and thereby its attorneys, actually represent the child. That’s not clear from the powerpoint, but it apparently came up in the oral presentation a lot. It also came up later in the GAL Program’s written responses to questions from the committee. The question below is asking if the GAL Program has rules in place about how its attorneys communicate with the kids. Attorneys owe special duties to unrepresented parties, so that should be an easy answer — “we follow the rule.” Instead, they wrote this:

So, let’s see if I can flesh that out. In the GAL Program’s view, the child is represented by the GAL (who is not a lawyer) and is therefore not unrepresented, so the GAL Program attorney does not owe the kids the same duties that all attorneys owe to unrepresented parties, even though the attorney actually represents the GAL who represents the child, but does not represent the child who is already represented by their own client. This is the sort of ethical contortionism that got them recommended for an investigation. What could it hurt, indeed.
Here’s why that one sentence “The children are represented by the GAL” doesn’t make sense under the Rules of Professional Conduct.
One, the GALs (as in the volunteers or staff) are not lawyers and therefore cannot “represent” the kids in the legal ethical sense. I know the Florida statute that appoints them says “represent,” but they advocate for the kids. There’s nothing wrong with the word advocate. If they think the statute really means represent, then they have a much bigger problem on their hands because of my next point.
Two, an organization isn’t a lawyer and therefore, under the Rules of Professional Conduct, can’t “represent” someone in the legal ethical sense, either. Law firms and lawyers represent people. Programs do not. And the GAL Program is not a law firm. The GAL Program advocates for the best interests of children, but they do not, in the legal ethical sense, “represent” children with all the duties and obligations that come with that word. If the statute requires them to “represent” the kids, then it requires them to reorganize into a law firm. Many people would love to see that, including many people who work at the GAL Program.
And last, but probably most importantly, the child is actually a separate party in dependency cases. The GAL Program would be asking their attorney to somehow represent the GAL and the child — two parties at the same time — without both parties giving a full conflict waiver on the record. The ethics rules don’t allow that, either.
My eye-roll at this whole debate is that the problem is not real. The attorneys at the GAL Program do not take direction from the kids and they don’t actually go rogue on their teams and sell them out without getting fired, which GAL attorneys certainly have been over the years when they stood their ground against their bosses. The attorneys know good and well who their client is because Tallahassee calls them on the phone and reminds them when they get out of line on a case. Nobody in a local program office likes getting those calls.
What appears to be happening is that the GAL Program leadership desperately wants to say that kids have attorneys (specifically GAL Program attorneys) for some fundraising or political reason. They know it’s not true because when you look at the GAL Program’s pay plan, which is the official document that designates the role of each employee, there is no ambiguity: the attorneys represent the GAL Program and provide counsel to the Program. That means all the normal legal ethical rules apply, including Rule 4-1.13. End of story.
I really wish that were the end of this story
I was actually going to end this post with some recommendations about how I would love to see the GAL Program start to use its attorneys because there’s no law that says they have to be used any specific way. (I gave a presentation at the disability conference a few weeks ago suggesting that the GAL Program use some of its attorney resources to do antipoverty work and school advocacy, especially since many of the GALs are now educational surrogates.) I was going to acknowledge in this post that there are, in fact, people who say that the GAL Program is harming children and who would like to see it shut down or substantially reformed (that part of the letter is accurate). And I was going to list out my own thoughts on ways that the GAL Program’s statewide model was holding the local programs back from meeting the needs of their communities better.
But in the middle of drafting those ideas out, this happened. Another letter, another claim that attorneys for kids will stand by as children are murdered in the damn streets. Who is writing these things?
This second letter was in response to the First Star Institute report on child representation. The First Star report declares that Florida does not adequately provide representation to children in foster care. Since the whole point of First Star is to grade states on their provision of direct representation, the conclusion was more or less a given. We’re actually up to a grade of C from an F in the last report, so that’s progress, I suppose.
All the GAL Program had to say was “they’re grading us on something we don’t do” and that would have been enough. Instead, they went further. This is the paragraph that got me.

Kids don’t decide to go home — judges have to order it. And, despite what is written above, the legislature specially appoints attorneys to the disabled kids to protect their legal interests at a level of vigor that GALs cannot generally do. I’m not making that assessment up: One, it’s codified in section 39.01305; and two, the GAL Program has acknowledged it publicly. In its analysis of the Foster Kid Bill of Rights last session, the GAL wrote that if foster kids have clearly defined rights, then the Program will need a lot more attorneys. See below.

The problem is that the Bill of Rights didn’t add any new rights — it was just a collection of pre-existing laws and regulations. So, apparently, nobody is advocating for them “expansively” now. That’s a problem.
The email above was different than most of the others that come out of the Program, though. I usually ignore ad hominem fundraising attacks on me and everyone who does the work I do. I’ve sat out of this debate for years because I believe there is room for GALs and AALs in the world and some kids need one or the other or both.
But I can’t sit this one out, because this particular email went and dragged math into it. I quote:

The email suggests that, based on the outcomes, the GAL Program is provably, mathematically superior to kids having attorneys represent them directly. That felt like a challenge. If it’s provably true, then let’s try to prove it.
Is the GAL Program Effective?
In our modern child welfare system, the fundamental question for any intervention is whether it works. This is the legacy of the early child welfare reformers who sought to create a science of caring. We have become an evidence-based system, full of actuarial instruments and six sigma streamlining.
The tragic irony is that the child welfare system is itself, at best, a mixed bag of results. By forcibly removing kids from poverty-stricken homes, we often exchange one set of harms for another. Any potential long-term benefits of intervention get drowned out by the much stronger pulls of community neglect, trauma, and social isolation.
GAL Program leadership clearly knows that it has to maintain a sense of evidence-based legitimacy. That’s why the First Star report referenced in the letter is so threatening. The casual reader may mistake the report for a study on outcomes. It’s not. It’s a measure of how each state is living up to the particular values of the organization that put out the report. They’ve been publishing that report for years, and the GAL Program responds almost every time. Nobody likes to get a “C” and the Program wants to challenge its grade.
This year the response was different, though. The letter does not just espouse the GAL Program’s values. It suggests that GAL Program model is provably effective. As evidence, it identifies some high-graded states that use an attorney model and points out that they have lower rankings than Florida in many federal outcome measures. That isn’t how math or logic works.
What does the research on best interests advocacy show?
There are no studies that I know of directly comparing best interest advocacy versus any other kind of theoretical model. There are studies, however, on GAL, CASA, and other external citizen review models. These models often employ best interests advocacy and the studies on them show mixed, but usually neutral or positive, results.
The studies are severely limited, though. First, it should be noted that many of the most positive studies come from the 1980s and 1990s during a time when child welfare looked very different from today. Back then, even some state agencies did not have attorneys in the courtroom, so the addition of a dedicated advocate for the child would have been revolutionary no matter what model they used. As an example, old studies often include a measure for the percentage of kids that had a performance plan — federal law requires that number to be 100% today and it generally is. Old studies are of limited use to determine current efficacy.
More recent studies have also produced a mix of conclusions. One longitudinal study found CASA-type appointment correlated with better outcome measures in Houston, while another study found that CASA appointment was correlated with a decrease in reunification. That study suggested future research needs to be done on the quality of the permanency outcomes that CASAs create. A consumer satisfaction survey showed that judges like CASA the most, while case managers and families like them the least. And yet another study found no differences between CASA and non-CASA cases on key measures.
Most of the studies of CASA/GALs have had serious limitations. Lawson and Berrick found that the rate of selection bias and poor research methods in the CASA research field was so prevalent that existing studies could not be relied on for or against the model. There has only been one true experimental study in this area, largely because research ethics and court rules wouldn’t allow it easily, and that study had other serious design flaws. Lawson and Berrick concluded that CASA/GAL representation is not an evidence-based practice, but may have other positive values.
The only studies I could find directly on the Florida GAL Program were qualitative and involved volunteer retention. A 2015 study looked at the reasons GAL volunteers stop working with the Program. The volunteer turnover rate in the circuit studied was approximately 30%. The short answer: 44% of the ex-volunteer group reviewed did not meet the work requirements (i.e., got let go or was fired), 24% relocated, 14% had life events interfere, and 10% just didn’t want to continue. A 2019 study on GAL Program recruitment showed that most GALs signed up after hearing about the Program through word of mouth and many were motivated to do so because they were going through their own life transition (e.g., retiring).
Studies on the impact of the GAL Program are possible, either at the child or system level. Kimberly Huggins-Hoyt out of Georgia State University has done interesting work on the statewide effects of privatization in child welfare. Someone could do similar research on the effects of representation models. Or someone could do an actual experiment and see what happens. There are statistical tools for measuring what we’re talking about here. Cherry picking some states that suck worse than Florida and happen to be in a report you don’t like is not a validated statistical method.
It was shortly after reading the second letter above that I remembered that the GAL Program actually does post stats on its performance. I found it odd that it didn’t cite them in their First Star reponse letter. Do those stats show any effect at all? Let’s find out.
The structure of the Statewide GAL Program
The Statewide GAL Program, as you probably know if you’ve read this far into the post, is a Florida state agency that provides support and oversight to the local guardian ad litem program offices. Its director is appointed by the governor and its staff are mostly state employees. I joined the Program in 2007. My paycheck came from one of the Program’s non-profit support organizations that raise money for the Program, and I moved over to the state payroll a year or two later. At the time, the legislature was not particularly interested in funding more attorneys. They currently employee around 170 attorneys, handling around 120 cases (not kids) each. Each case probably has 1 to 3 kids. The attorneys make around $45,000 to $50,000 per year.
The local programs had been around for decades, housed inside the court system. The independent Statewide GAL Program was born in 2003-2004 through some impressive advocacy by champions of the cause and some ethical questions around whether the GAL could be a party and a part of the court at the same time. It was, in a sense, born of an ethics complaint. Its volunteer-centric model was heralded as both cheap and effective, with an initial budget of just over $10 million.
The legislature set a goal for every child to have a guardian ad litem by no particular date, and tasked the Statewide Program with making that goal a reality (thus the studies on volunteer recruitment above). Over the last 15 to 16 years, its budget has grown by 500% and its representation numbers have gone up and down, but are currently down somewhere between 3% and 15% from 2007 (depending on which dataset you use to count kids). Since 2003, over $600 million has been appropriated for the GAL Program (this does not include funds raised by its direct support organizations). It has never, however, hit the full statewide representation rate of 100%.

Right: Legislative appropriations for GAL Program since 2004.
The GAL Program is primarily a legal advocacy organization, which sets it apart from most child philanthropy endeavors. Volunteers do the field work, but the administrative work (and much of the report writing) is largely done by staff. The courtroom work has always been the hardest part for most volunteers. Early advocacy from the GAL Program involved seeking a statutory hearsay exception for their reports so that the GALs did not have to testify directly. It was not successful.
The use of staff attorneys was expanded to keep the Program on equal footing with DCF and parents, both of whom had attorneys. It also provided protection and support for GALs in court. The GAL program attorney position is not required by statute — it’s a policy and spending decision the Program’s leadership make to enhance its effectiveness. It has recently expanded its appellate program through recruitment of pro bono attorneys to handle appeals.
The GAL Program is therefore unusual and possibly unique. The Program has full party status under Florida law; it has trial attorneys in the trenches and an appellate team on standby at all times; and it has a full statewide reporting structure that goes all the way to Tallahassee, where it pushes for funding and legislative changes each year. It is probably the most deeply embedded, well-funded, and legally authoritative expression of best interests advocacy in the country. If best interests advocacy can change a child welfare system for the better, then the GAL Program should be doing it.
The Data and Design
Consistent with its courtroom focus, the GAL Program publishes its monthly performance data by court circuit. These Performance Advocacy Snapshot (PASS) reports track the percentage of kids appointed to the GAL Program, the percentage of active volunteers, the child to volunteer ratio, the volunteer retention rate, and GALs that are qualified to provide transportation and education advocacy. The Program also publishes monthly representation reports that break down the county and circuit numbers in more detail, and a few other reports with charts and graphs.
The PASS Reports lists outcome measures as “GAL Influence on Child Welfare Outcomes.” Those measures are:
- Percent of Kids in Care 8 Days to 12 Months with No More than 2 Placements,
- Children Achieving Permanency in 12 Months of Entering Care,
- Children Not Re-Entering Out-of-Home Care within 12 Months of Achieving Permanency,
- Foster Foster Youth Ages 19-22 with a Diploma or GED, and
- Percent of Adoptions Within 24 Months.

This is the data we’ll use to test for an effect. Despite some obvious problems with experiment design here, this is a legitimate endeavor because the GAL Program holds these numbers out as evidence of its impact. As the main test variable, I’ll use the percentage of kids in each circuit who are appointed a GAL, because that is the measure that the legislature has set as the goal and the main measure the GAL Program uses in its reports.
The plan is to look for significant correlations between GAL appointment rates and the “influence” measures listed above. This would normally be the time to say that correlation does not prove causation, and in most circumstances we would need to be very careful with that. But here, the causation has already been declared and we’re working backwards to test whether it is justified given the existing data. The main questions is: Does the public data support a claim of causation, correlation, or “influence”?
To make the calculations more manageable, I had to make the following adjustments:
- I’m using the combined Circuit 18 numbers, instead of separating them out by CBC, because the focus here is on the GAL model and not the CBC model.
- I am separating out Orange and Osceola counties because Orange county’s model is significantly different in that it uses attorneys instead of lay GALs. That gives us 21 circuits.
- I inverted the re-entry measure in the PASS Reports to the percentage of kids who did re-enter care in 12 months, because the negative in the original was confusing.
- I’m using the simple average of the last six months of 2018 as the time frame so that we’re not victim to an abnormal month. I realize there was a hurricane during that time, but those are real-world conditions in Florida and we’ll check for outliers as we go. The GAL Program also doesn’t seem to have PASS reports on their website for the first half of 2018.
- Some GAL and DCF reports are in months and others are in quarters, so the measure will be the average of six months or two quarters.
- I did not run every standard test on every pair of variables. They appear to be mostly normal and I’ll do outlier tests on a case by case basis. I’m also not labeling partial correlations using the rpartial notation. It’ll be clear from context when it’s a partial.
- Finally, we are looking at the effect of GAL representation rates on a circuit’s outcomes. We cannot say anything about individual kids from this data.
Here is a spreadsheet with all of the raw numbers for the calculations. I hope someone will check the math and go even further with it. I’ve tried to be as careful as possible, but this is a blog post and not a peer reviewed article. If something is wrong, I’m sure someone will tell me and we will celebrate that we had a fact-based conversation about the benefits of the various representation models. Maybe one day this post will turn up on Lawson and Berrick’s list of bad research. I would be honored if it resulted in anyone doing good research to rebut it.
Here we go.
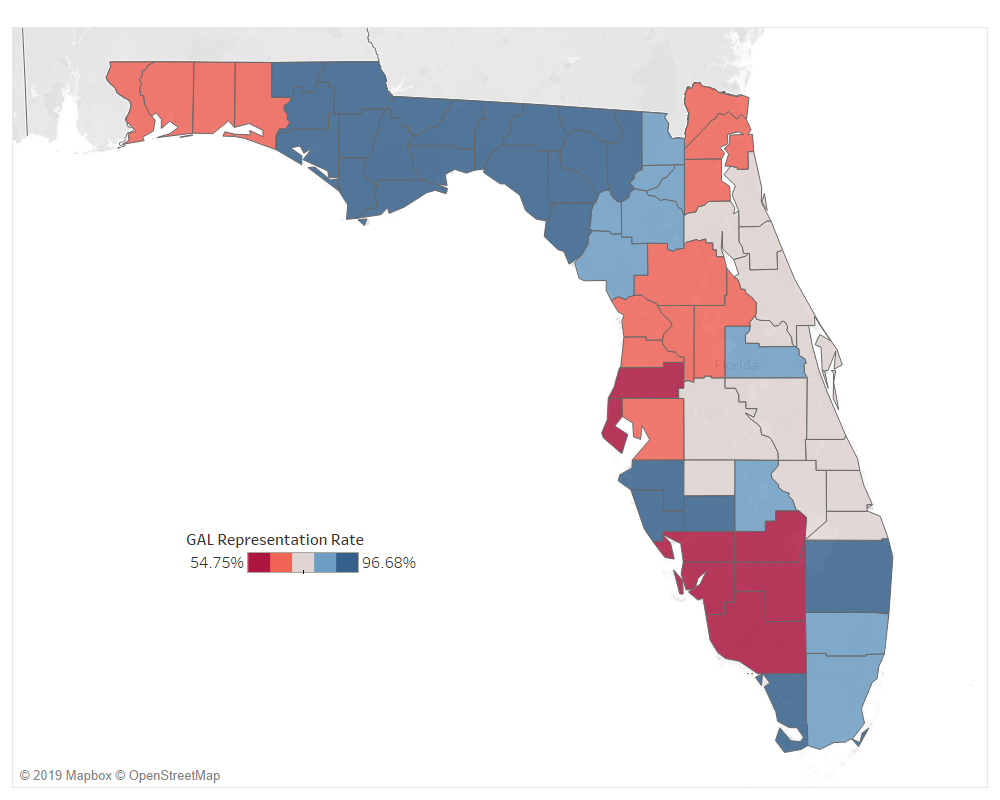
GAL Appointment Rates Aren’t Uniform Statewide
Despite the statewide goal of 100% representation, the circuits showed a large variation in the percentage of kids appointed a GAL. Over the last six months of 2018, the circuits had an average GAL representation rate of 79.7% with a standard deviation of 12.4%. The high was 96.68% in Circuit 14 and the low was 54.75% in Circuit 20. The distribution is normal. This gives us a way to test for an effect using a natural experiment. We’ll try to control for the factors that could be affecting GAL appointment rates.

A visual check of the scatterplot below shows that the relationship between the GAL representation rate and circuit size (as measured by its out-of-home care population) is linear. There is a significant, strong negative relationship between the number of kids in a circuit and the percent of them that have a GAL, r(19) = -.659, p = .001. (That’s even true with Circuit 20 in the mix, which is clearly an outlier in terms of GAL representation.) This means that 81% of the variability in GAL representation rates can be explained by circuit size. The bigger the circuit, the lower the percentage of kids who are assigned to the GAL Program. That makes sense because, as the studies discussed above suggest, volunteer recruitment and maintenance is hard.

What about that other 19% of variability? I suspected two possible sources: demographics and economics.
As the simplest demographic explanation, I suspected that circuits with bigger populations would have higher representation rates because they had more people to pull volunteers from. However, there was no significant correlation between the percent of kids with a GAL and the circuit’s total population, r(19) = -.271, p = .235.
I suspected that circuits with fewer kids in out-of-home care per capita would have higher representation rates, on the theory that there is some volunteer penetration rate that the OHC per capita rate would play against. But again, there was no significant correlation, r(19) = -.219, p = .341.
Reaching to the studies that show that GALs tend to be older and female, I used the American Community Survey from 2017 (the latest year I could find) and calculated the weighted percentage of the population of each circuit who was female and age 50+. There was again no correlation to the percentage of kids with a GAL and the percentage of older women in the circuit, r(19) = -.247, p = .280.
There are other studies that show that GALs tend to be white(r than the kids they represent, at least). There was no correlation between GAL rates and the whiteness of the circuit, r(19) = -.281, p = .217.
I gave up on demographics. Size matters.
As for economics, I started with the theory that circuit income would correlate with volunteer rates. I created income indices based on the weighted average of each circuit’s county income per capita and the out of home care population. No correlation was found with GAL representation, r(19) = -.073, p = .753.
I next tested whether circuits with higher philanthropic giving rates would have higher GAL representation rates. I created a proportional Giving Index based on the size of the counties and the counties’ Giving Ratio in the How America Gives study. There was no significant correlation, r(19) = .361, p = .108, but it was suggestive (which I’m defining as p < .200). A look at the scatterplot (not shown here) shows that two circuits may be outliers, but it’s hard to say whether they can be validly removed.
Looking at Income Inequality, I calculated a weighted Income Inequality Ratio (IIR) for each circuit based on its county IIR and OHC population. The county IIR is defined at the 80th percentile income divided by the 20th percentile income, giving the ratio of the highest and lowest earners in the county. The result was just shy of significant and positive, r(19) = .431, p = .051. Controlling for OHC population size, the IIR is strongly correlated with GAL rates, r(18) = .535, p = .015. It explains 75% of the GAL rate variability after controlling for size.
Along the same lines as Income Inequality, when controlling for OHC size, a circuit’s OHC Racial Disparity, r(18) = .468, p = .037, and Violent Crime Rate, r(18) =.518, p = .019, are both positively correlated with GAL representation rates. That’s the holy trinity of injustice and overrepresentation in punitive systems.
So, for the rest of this post we’ll occasionally control for OHC population (size), Income Inequality (socioeconomics), OHC Racial Disparity (race), and Violent Crime Rate (community safety) to see if GAL representation has any correlation beyond those. Because we’re assuming strong causation, the GAL representation rate effect should survive controlling for correlated variables. Not all of these controls make sense for every effect. There will need to be some reasonable theoretical connection.
Oh, and since we’re assuming causation here, I do want to state that I do not think that GALs are pushing up community variables like Income Inequality or Violent Crime. The OHC Racial Disparity correlation, however, should give us pause. It’s defined as the ratio of over-representation of non-white kids to the under-representation of white kids in the foster care system — it’s not a community variable, and bigger numbers mean more racial disparity. Racial disparity is the sort of thing GALs have been accused of having very unfortunate effects on, and a fact that National CASA takes very seriously. Seeing a correlation here is not good.
Does the variation in GAL representation correspond to variations in circuit outcomes?
So the theory is that higher GAL representation rates should correlate with better circuit outcomes. The difference between 50% and 95% of kids having a GAL should result in some kind of measurable effect. To test that, I ran a Pearson product-moment correlation using SPSS on the GAL’s representation rate during the time period and the “influence” measures listed in the PASS reports. What did I get?
The correlation chart is below. Significant correlations are highlighted in yellow. There’s no significant correlation shown between GAL appointment rates and any of the measures listed in their PASS Reports.

The only significant correlation is the somewhat unobvious negative correlation between kids who get their diploma after aging out and placement stability. (Maybe circuits with more teens have more instability and conversely work harder on education goals?)
There is one suggestive correlation between the GAL representation rate and the percentage of kids who are adopted in under 24 months, r(19) = .300, p = .186. A check of the scatterplot for the adoption statistic shows that Circuit 4 may be an outlier. That’s Jacksonville, a circuit that’s notorious for fast adoptions. That’s reason to believe we should omit it from the analysis.

If we remove Circuit 4, we get a moderate positive, statistically significant correlation between GAL appointment rates and adoptions under 24 months, r(19) = .485, p = .030. That’s a good stat for the Program.
Notice, however, that the size of the out of home care population is also correlated with the adoption statistic. If we control for the size of the circuit’s out of home care population, then the correlation between a circuit’s GAL representation rate and its percentage of kids who are adopted in under 24 months disappears, r(18) = -.004, p = .986.
Summary: The data does not show a significant correlation between GAL appointment rate and adoption timing when controlling for circuit size.
Controlling for Size, Race, Inequality, and Community Safety
The next step is to run the correlations again while controlling for the demographics discussed above. First, OHC Size and IIR.

We again get a suggestive correlation, this time with the Percent of Kids Re-entering Care in 12 Months of Discharge, r(17) = .446, p = .056. According to DCF’s dashboard, which this PASS measure seems derived from, the 12-month period is counted from the time a case fully closes (“termination of supervision” or “TOS”). This means the GAL Program would be discharged and no longer working the case. The correlation is not in the direction I would have guessed: controlling for circuit size and IIR, GAL representation rates may be positively correlated with kids reentering care after TOS.
Again, that’s only a suggestive correlation, so we should look more closely at it. Below is the scatterplot for GAL Rate, controlling for OHC size and IIR. It’s hard to say what the outlier is here. I’m aware that Circuit 20 has very low GAL appointment rates for its own reasons, so removing it makes sense. Circuit 14 was a hurricane circuit, so maybe it can be omitted reasonably as well. Removing both outliers gives us a significant, strong correlation between GAL appointment and re-entry rates, r(15) = .593, p = .012. This is not good. We don’t want cases coming back in.

There’s no additional correlations that pop out from controlling for Violent Crime or Racial Disparity.
So what does that all mean? First, it means we cannot say from the circuit level data that the percentage of kids who are appointed a GAL has any direct correlation with — much less any influence on — the proposed circuit outcome measures.
Second, by controlling for circuit size and socioeconomic factors (and by omitting two circuits that seem to be reasonable outliers), it appears that the GAL representation rate has a positive correlation with the percentage of kids that re-enter care in 12 months. Size and economics being equal, circuits with more GALs on cases have more kids come back into care after TOS.
We don’t know if those re-entries are from failed reunifications, guardianships, or adoptions, but we know the placements didn’t last. That’s not a good statistic for the GAL Program which is supposed to be achieving the “best” outcomes. If the kids are coming back into care at higher rates in circuits with more GALs, that could be a problem.
What about DCF’s Outcome Measures?
I found it odd that the GAL Program PASS Reports suggest that GALs influence the number of kids who age out and get diplomas (unlikely), but don’t include a lot of other DCF measures that the GAL could reasonably have a much larger effect on, like medical and dental care, sibling separation, placement stability, or abuse in care rates. So let’s look at those.
I calculated 15 measures from the DCF dashboards and correlated them against the GAL representation rate. Here’s what I found.
Placement Patterns

The only direct significant correlation with the GAL appointment rate was found for the number of kids placed in their removal circuit, r(19) = -.511, p = .018. This seemed like another circuit size effect, and sure enough there is no correlation when controlling for out-of-home care population, r(18) = -.280, p = .231. Cross this one off.
There is a suggestive correlation between GAL appointment rates and the percent of kids in foster care in a circuit, r(19) = -.377, p = .092. This time a review of the scatterplot shows that the Southern Region may be the outlier. Regardless, the correlation does not survive controlling for circuit size, r(18) = -.208, p = .379. Cross this one off, too.

Abuse in Care
This next section looks at how the GAL rate correlates with various abuse investigation measures. Turns out it is strongly negatively correlated with both the number of investigations and number of foster care referrals (abuse in care).

Using counts instead of percentages usually runs into a size effect, though, and these both seem related to the size of the circuit. Sure enough, they melt away when controlling for OHC (below). Cross them off.

When controlling for circuit size, the closest suggestive correlation was between GAL appointment rates and the number of verified abuse allegations per 100,000 days in care, r(18) = .414, p = .069.

The scatterplot below suggests that Circuit 20 is again an outlier due to its low GAL rate. Removing it from the analysis, we obtain a strong positive correlation between GAL appointments and abuse rates in care, r(16) = .634, p = .005.

Why would GAL representation result in more kids being verified abused in care? There is an obvious hypothesis: maybe GALs call in the abuse reports. Unfortunately for that theory, when controlling for OHC size, there is no correlation between GAL representation and the total number of abuse investigation intakes or the total number of foster care abuse investigations.
That leaves the possibility that the rate of calls doesn’t go up, but the verification rate goes up when there is a GAL on the case. Either GALs are providing convincing evidence or argument to investigators or the situations are just worse. We cannot test that hypothesis using circuit level data. It’s worth looking into.
Everything else
I expected GAL rates to have the most effect on the next group of measures. Instead, they had none. Circuit level permanency timing, dental care, medical care, and the reunification and adoption rates all showed no significant correlation to the GAL appointment rates.

Even taking into account OHC, Racial Disparity, Violent Crime Rates, and Income Inequality, there was still no correlation.
There are two suggestive correlations with the Reunification and Adoption rates. These are very important numbers, so we should look closer. The reunification plot appears linear, but the adoption plot may not be. When you control for OHC size, it’s even more scattered. GAL representation rates do not seem to have any significant correlation to the percent of kids adopted or reunified in a circuit. To the extent they’re suggestive, GALs may depress reunification and accelerate adoption.


Let the lack of correlation sink in
What struck me most is the long list of circuit measures that had no correlation with GAL appointment rates. Here they are below, with their r and p values (r, p). A p-value less than .05 is significant and most of these are nowhere close. I thought for sure that circuit-level GAL appointment rates would correlate with medical and dental care rates, or with siblings being placed together, or with minimizing the number of moves. They didn’t.

What’s worse, if you want to measure “influence” instead of correlation, a higher GAL Appointment rate in a circuit was more strongly correlated with worse results in five measures when controlling for OHC size and IIR. That was shocking to me: GALs correspond to worse outcomes. Only the correlation for RTC rate got stronger and kept a “better” direction, but it is still very weak and not statistically significant.
Summary: There were no significant direct correlations between GAL representation rates and any of the DCF Dashboard measures that survived controlling for circuit size. Controlling for size and socioeconomics and removing one outlier circuit resulted in GAL representation being positively correlated with abuse in care.
Furthermore, if non-significant “influence” is how we’re measuring and we’re assuming causation (two things you SHOULD NOT DO in a normal situation), then the GAL Program is failing and possibly even bad for kids on four additional measures that appear to be core to its mission.
So what measures do correlate with child welfare outcomes?
It would be tempting to think that circuit level data is just too coarse to find a real correlation. Not so. I gathered socioeconomic data on the circuits in question from the County Health Rankings & Roadmaps data for 2018. Because it doesn’t include circuit data, I created a proportional circuit value by taking the weighted average of the county data and the number of kids in care from each county in that circuit. It’s not perfect, but it works.
Here’s what I found. If you control for circuit OHC size and IIR, the partial correlations below are significant. This list is going to be overwhelming to read so I’ve included plain English summaries after each section. The point is that lots of things correlate strongly to the outcomes we’re seeking to measure. For most, though, GAL rate just isn’t one of them.
Reminder: all of these are partial correlations controlling for OHC size and Income Inequality Ratio.
The percent of kids re-entering care in 12 months is…
- Positively correlated with the circuit population, r(17) = .598, p = .007;. the unemployment rate, r(17) = .477, p = .039; and the percent of kids living in poverty, r(17) = .464, p = .045.
- Negatively correlated with the number of mental health providers per 100,000 people, r(17) = -.489, p = .034; excessive drinking rate, r(17) = -.456, p = .049; per capita income, r(17) = -.457, p = .049.
- Suggestively correlated with racial disparity (+), the chlamydia rate (-) , the reporting rate of poor or fair health (+), the food environment index (+), the number of PCPs/dentists/mental health providers per 100,000 people (-), the number of community associations per 10,000 people (-), and the county surtax rate (-).
- Suggestively correlated with the GAL representation rate, r(17) = .446, p = .056; but strongly correlated when you remove two outlier circuits. [edited for clarity here.]
Summary: community health effects, poverty, and access to health care all appear to have significant correlations to the rate at which kids re-enter care. The GAL Representation rate correlation is even stronger, however. This is not good for GAL.
Percent of kids having two or fewer placements is…
- Positively correlated with the percent of children in single parent households, r(17) = .514, p = .024;
- Suggestively correlated with the weighted county surtax in the circuit (-); unemployment rate (+); excessive drinking (-).
- Not significantly correlated with the GAL representation rate, r(17) = .044, p = .857.
Summary: circuits with lots of single-parent households also have fewer kids that have stable placements.
Percent of kids reaching permanency in 12 months is…
- Suggestively correlated with excessive drinking (-).
- Not significantly correlated with the GAL representation rate, r(17) = .075, p = .761.
Summary: there’s no community effect that correlates with the percentage of kids reaching permanency in 12 months. This seems totally driven by system factors.
Percent of kids who aged out and got a diploma or GED is…
- Positively correlated with the circuit’s high school graduation rate, r(17) = .469, p = .043
- Suggestively correlated with excessive drinking (+); mental health providers per 100,000 people (+); violent crime rate (+); kids living in single parent households (-); the county surtax (+); and the percentage of elderly women living in the circuit (-).
- Not significantly correlated with the GAL representation rate, r(17) = -.010, p = .967.
Summary: Circuits with higher graduation rates also have higher graduation rates in their IL populations.
Percent of kids who were adopted in under 24 months is…
- Suggestively correlated with the racial disparity index (-); low birth weight rates (+); discharges to ambulatory care (i.e., use of ER for routine care) (+); and the teen birth rate (+).
- Not significantly correlated with the GAL representation rate, r(17) = -.282, p = .243.
Summary: there’s no community effect that correlates with the percentage of kids who were adopted in 24 months. This seems totally driven by system factors.
Percent of kids receiving Dental Care in Last 7 Months is…
- Strongly positively correlated with the percentage of elderly females in the circuit, r(17) = .768, p < .001; the percentage of the circuit that is white, r(17) = .618, p = .005; the accidental death rate, r(17) = .670, p = .002; Rural Urban Continuum Code (less urban circuits had more timely dental care), r(17) = .524, p = .021.
- Strongly negatively correlated with the chlamydia rate, r(17) = -.629, p = .004; the violent crime rate, r(17) = -.599, p = .007; and the PM2.5 Pollution Measure, r(17) = -.635, p = .003.
- Suggestively correlated with the number of mental health providers (-),
- Interestingly, it was not correlated with the number of dentists per 100,000 people in the circuit, r(17) = .167, p = .494.
Summary: circuits that are whiter, older, and less polluted have higher rates of timely dental care. Air pollution corresponds with industrialization and other environmental health factors, so this may not be crazy. Also, the increase in the elderly population may indicate an increase in Medicare/Medicaid providers. That’s worth looking into.
Percent of kids receiving Medical Care in 12 Months is…
- Strongly positively correlated with the percent of the circuit that is white, r(17) = .568, p = .011; the percent of the population that is female and 50+, r(17) = .610, p = .006; the accidental death rate, r(17) = .635, p = .003; the Rural Urban Continuum Code (less urban had more time medical care), r(17) = .593, p = .007.
- Negatively correlated with the PM2.5 Pollution Measure, r(17) = -.467, p = .044; and the violent crime rate, r(17) = -.546, p = .016.
- Suggestively correlated to the percent of the circuit that is white (+), the chlamydia rate (-), the food environment index (-), mental health providers per 100,000 people (-), number of community associations per 10,000 people (+), and percent of households with a severe housing problem (-).
- Not significantly correlated with the GAL representation rate, r(17) = -.076, p = .756.
Summary: circuits that are whiter, older, less urban, less polluted, and less violent give timely medical care more often. Again, it’s worth looking into the number of Medicaid providers to see if that’s holding up the rates.
Percent of kids in RTC Care is…
- Strongly positively correlated with the Proportion of Circuit Reporting Poor or Fair Health, r(17) = .520, p = .023; the Proportion of a Circuit’s Average Poor Health Days, r(17) = .670, p = .002; the Proportion of a Circuit’s Kids in Poverty, r(17) = .538, p = .018; the teen birth rate, r(17) = .556, p = .014; average poor mental health days, r(17) = .560, p = .013; discharge from ER to ambulatory care, r(17) = .539, p = .017; percent of kids in poverty, r(17) = .541, p = .017; Rural Urban Continuum Code (less urban had more RTC usage), r(17) = .488, p = .034.
- Negatively correlated with a circuit’s Per Capita Income, r(17) = -.727, p < .001; access to exercise, r(17) = -.690, p = .001; households with at least one severe housing problem, r(17) = -.460, p = .048.
- Suggestively correlated with the percent of low birth rate (+), food environment index (-), percent uninsured (-), high school graduation rate (-), kid living in single parent households (+).
- Not significantly correlated with the GAL representation rate, r(17) = -.163, p = .505.
Summary: poorer, unhealthier circuits have greater usage of RTC care.
There are interesting symmetric correlations with adoption and reunification.
- The Percentage of Kids Exiting to Reunification is strongly negatively correlated with a Circuit’s Reported Number of Poor Mental Health Days, r(17) = -.558, p = .013.
- Conversely, the Percentage of Kids Exiting to Adoption is positively correlated with a Circuit’s Reported Number of Poor Mental Health Days, r(17) = .627, p = .004; number of poor mental health days, r(17) = .630, p = .004; lack of access to exercise, r(17) = .473, p = .041; percent insured, r(17) = .485, p = .035; and pollution levels, r(17) = .462, p = .047. [Note: I’ve flipped the signs on some of these measures to align them.]
- The adoption correlations around mental health are stronger than the one reunification correlation.
- There was no correlation between the GAL representation rate and adoption or reunification rates.
Summary: circuits with poorer community mental health and environmental conditions reunify kids at lower rates and adopt kids out at even higher rates.
To sum that all up: poverty levels, racial makeup, mental health, physical health, healthcare access, and even the environmental quality of the circuits all have a stronger correlation to the DCF Dashboard outcome measures than the GAL representation rates do.
Discussion
So the bottom line is that the GAL representation rate in a circuit doesn’t significantly correlate with anything that the GAL Program suggests it does. If the effect is too small to measure at the circuit level, then that’s evidence against the original premise that GAL representation is a significant factor in positive system outcomes. The aim for 100% GAL representation of all kids in Florida may not be the right goal.
To the contrary, the GAL representation rate, when partially correlated for OHC size and IIR, was associated with two negative outcomes: more kids coming back into care after TOS and more kids being found to have been abused while in care. If that’s because kids are winding up in worse placements, we need to know that. If that’s because GALs are raising more complaints after they’re in a bad placement, we need to know that, too. While the detection of problems may be a net positive, the supposed power of best interest advocacy is to avoid problems, not just identify them after the fact. We probably need better studies into the quality and timing of the recommendations that GALs make.
We also have to accept the possibility that best interests advocacy, even armed to the teeth, may be an insufficient tool to affect outcomes in the face of widespread community poverty. It appears that there are community health effects that far overpower the GAL representation rate as a correlative factor in outcomes. There are plenty of studies that suggest that CASA/GAL advocacy results in higher chances of adoption over reunification on individual cases (even if we didn’t see it at significant levels here), but I don’t know of any study that compares this to other community effects like poverty, health access, and environmental factors. Comparing GALs to AALs may not be the right test. If it turns out that the number of community doctors and therapists who take Medicaid has a stronger and broader impact on foster care outcomes than GALs do, then we could have spent the $600 million GAL Program budget in very different ways.
It seems counterintuitive that circuits with higher GAL rates would have (non-significant) lower rates of timely medical and dental treatment. This raises the possibility that GALs create a moral hazard in the system. The existence of an assumed-effective watchdog like a GAL may incentivize the system to act only when that watchdog alerts to a problem. If the quality of the GAL advocacy is poor, the system may mistake silence for a lack of problems, which then reproduces more problems. Recall that nearly 45% of GALs that separated from the Program were terminated for not meeting the expectations of the job. Forget GALs who may have acted badly — if those GALs just did nothing while on the job, that alone could explain how higher GAL rates could result in worse outcomes. We need to look more closely at GAL work processes and outputs.
The ultimate question, of course, is whether GALs actually offer meaningful and sustainable solutions to the system. It’s not about kindness or good intentions; it’s about quality. There have been a few sociological and legal studies looking at the gap in socioeconomic status between the families in the system and the people who volunteer as GALs. These studies highlight the disconnect that can happen when well-meaning people try to give advice to others with significantly fewer resources and different experiences than they have had. Maybe GALs just don’t know how to navigate our families’ worlds. That’s ok — they can help in other ways.
So, after all this, the question of whether the GAL Program is ethical, effective, or even good for children is all the same: we don’t know. And before we spend another $600 million, we should probably find out.
Leave a Reply