I wrote last month that if there wasn’t a big jump in the number of kids being removed by October (the typical high-point in Fall removals) then I was going to call the COVID prophecies bunk. And here we are with the October data and…nothing. The October removal numbers came in lower than expected.
[November update: I’m not doing a whole new post for November, because there’s still no surge. You can see the dashboard here.]
Below are the numbers for January 2014 to October 2020, taken right from the DCF dashboards. The grey line is a trend line that calculates the median value for +/- 6 months. And, seriously, if you didn’t know there was a global pandemic that had locked down entire countries, closed schools, and possibly changed the course of history, you certainly wouldn’t have guessed it based on these charts (and I even highlighted COVID for you). The child welfare system experienced some shocks at the beginning, but for the most part it adapted and carried on.

Below is the exact same set of numbers with the normal seasonal variations taken out. This lets you see what is unusual. You can see that abuse calls in April 2020 were unseasonably low, but they got back up there. If you look at Hurricane Irma in 2017, you’ll see that the whole system took a pause — calls, removals, and discharges were all lower that month. But the pandemic seems to have only temporarily reduced calls, delayed some exits to September 2020, and pushed removals into an abnormal pattern that is reflected by that saw-tooth line starting around September 2019. What COVID didn’t do: impact the out-of-home care population hardly at all.

It looks like discharges had a rebound in September, clearing out cases that had stalled due to lack of court and closed services. You can see the bump in all three types below: reunifications (17%), adoptions (34%), and guardianship (27%). The adoption number should be put into context, though — the adoption trend line is dropping, suggesting things are slowing down, but only time will tell if that trend continues.

If I were to write a short factual statement on how COVID affected Florida’s statewide numbers, it would be this:
Florida’s been in a very gradual contraction period for a few years, due in large part to a reduction in the number of kids entering the system. The trend was 1,428 kids removed per month in February 2016 and 1,128 in February 2020. When COVID hit, removals got thrown off their normal schedules, but the trend line remained the same. Discharges had been very stable before COVID and were slightly down going into 2020. COVID dropped discharges a lot more, from about 1,100 per month to 960 per month. We saw a huge spike in discharges in September, but we need to do more to get the trendline back up.
Not everywhere in Florida had the same experience
Florida’s system is a patchwork of community based care agencies, and they rarely move in lockstep. Some agencies did in fact experience dips and surges not seen in the statewide numbers. I made a charts for each of the 19 CBCs. And, I’ve included a short factual statement you can make about each of them based on the numbers. The big takeaway is that across the state COVID had way more impact on discharges than removals, but mostly it had little effect at all on the out-of-home care population. (A more sophisticated analysis would look at the demographics and reasons kids came into care during COVID and test for shifts there — this is not that.)
If you want to go through the data in more detail (down to the county level), you can do so at this dashboard I made.
One important note: COVID significantly affected the quality of life of kids and families in the system by denying in-person visits, reducing court access, closing schools, and a million other ways. The DCF dashboard numbers don’t measure those things. These charts are only about how COVID affected the core system metrics of removals, discharges, and overall population.
Another important note: I’m not including the hotline calls for two reasons. First, DCF does not report hotline calls by CBC, so the info is not readily available. Second, the number of hotline calls have very low (almost no) correlation to actual removals.
| Agency | What that agency can probably say about the data |
|---|---|
| Big Bend CBC | We’ve been in a slow expansion for years, but our removal and discharge rates have remained fairly constant. COVID rose our removals a little, but not much. Our discharges have always been slow, but they picked up in this summer in small part because we entered more guardianships than usual. Our rising out-of-home care population trend hasn’t changed. |
| Brevard Family Partnership | We’ve been in an expansion period since 2018. Our removal numbers are normally pretty volatile from month to month, but the overall trend has been stable over the years. COVID may have raised our removal trend from 46 to 54 kids per month starting in August, but it’s too early to tell if that will last. We had low discharge rates before COVID (34 per month) and really struggled with reunifications at the beginning through September. We may be back on track. |
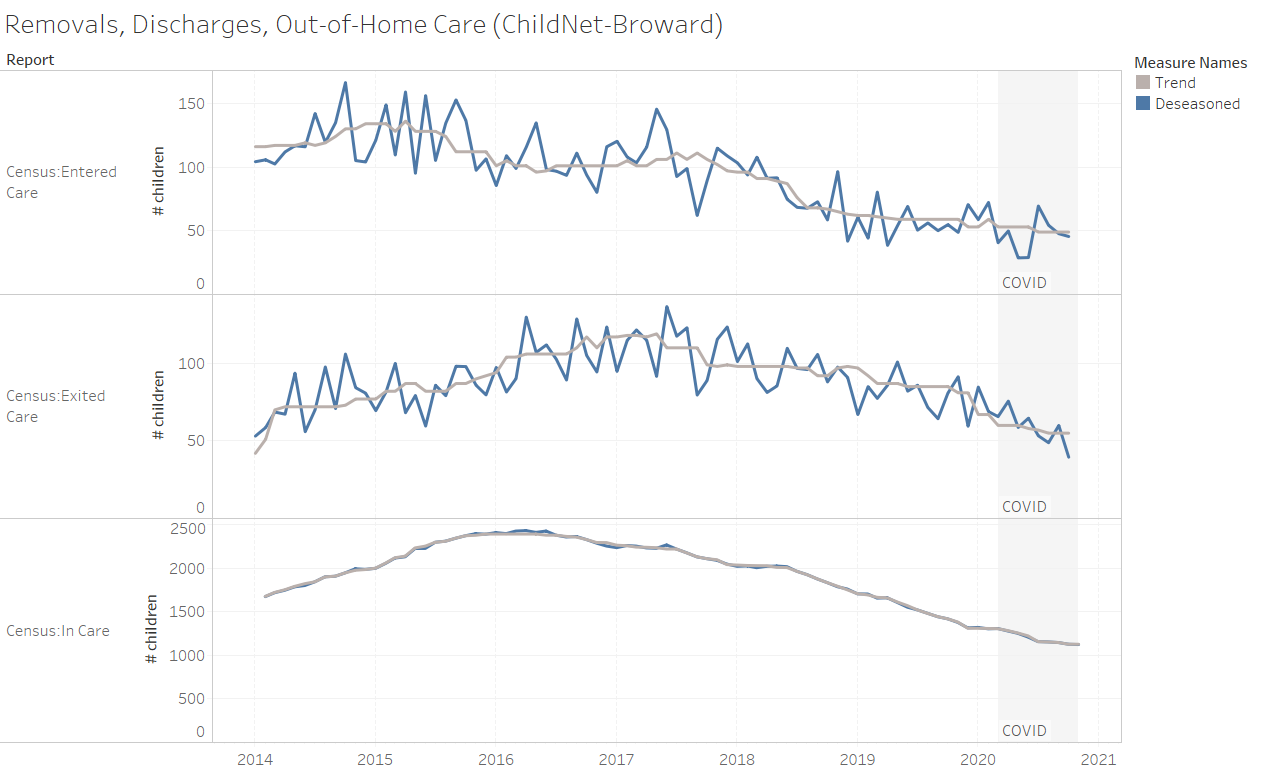
| ChildNet Broward | We’ve been in a contraction since 2016, and our removal rate has been decreasing throughout that time. Removals came in really low at the beginning of the summer, but rebounded in July and seem back on track. Reunifications over the summer stalled a bit, but overall things have been stable. |
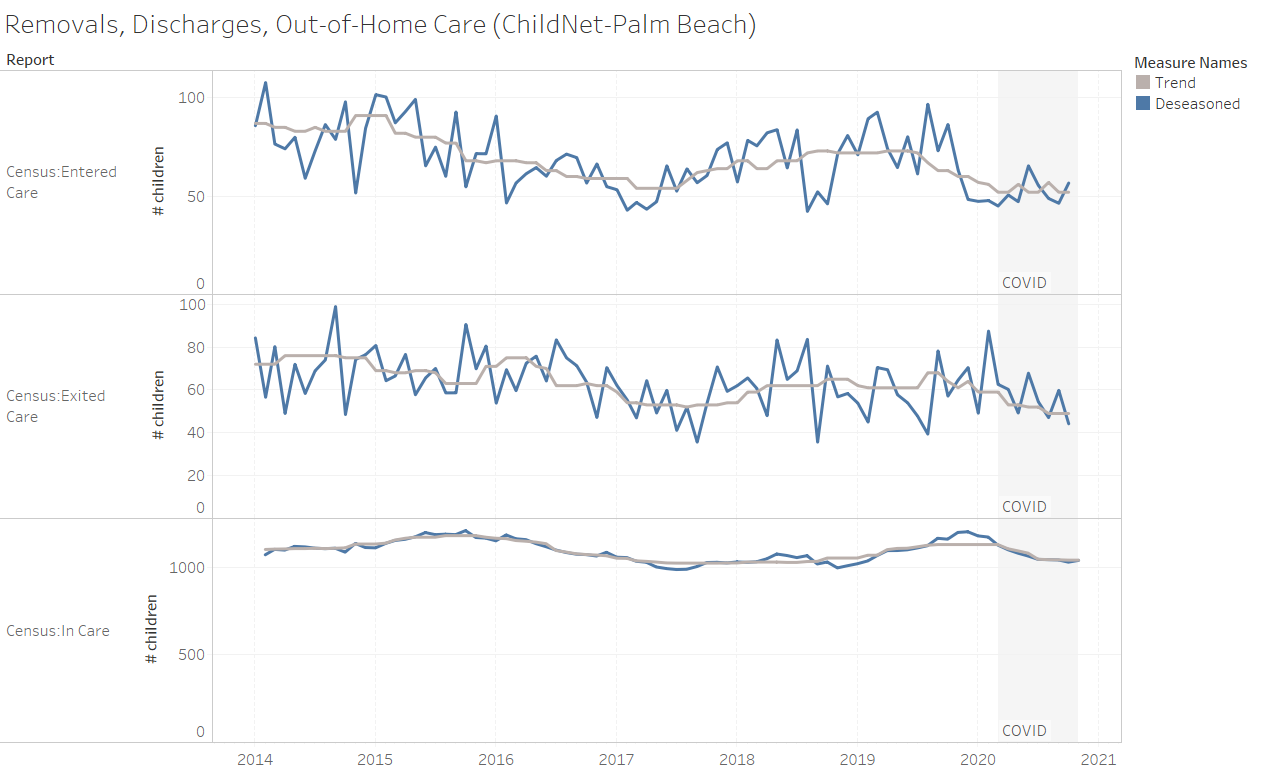
| ChildNet Palm Beach | The pandemic hit at an odd time for us. We had a small expansion from October 2019 to November 2020 and were already clearing that out when COVID struck. Removals had already been down since December 2019 (60 per month) and stayed low after that (52 per month), with a small bump in June. Discharges have steadily decreased and COVID didn’t really change that. |
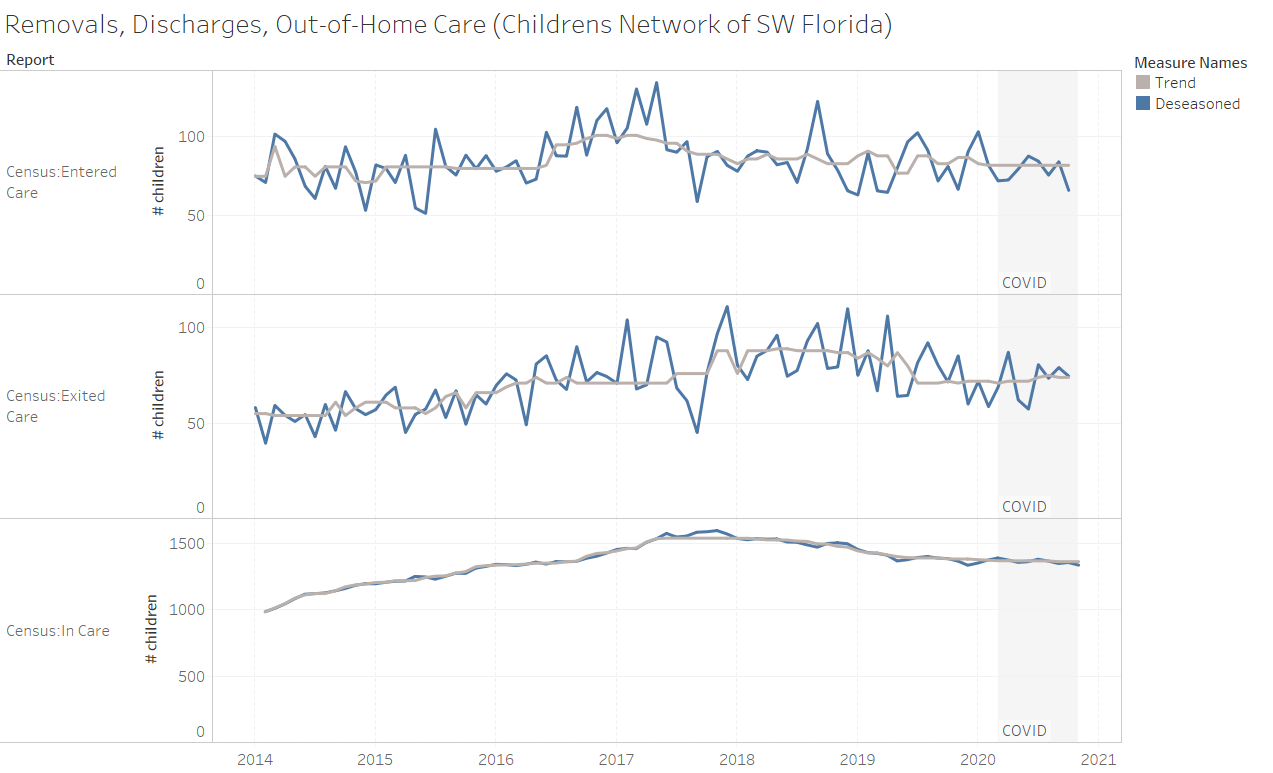
| Children’s Network of SW Florida | What pandemic? Our removal trend numbers haven’t budged since 2018 and discharges have been steady for a year. We reunified a bunch of kids in April and lagged a little on guardianships and adoptions, but it all came out in the wash. Especially since we did a ton of adoptions in October. |
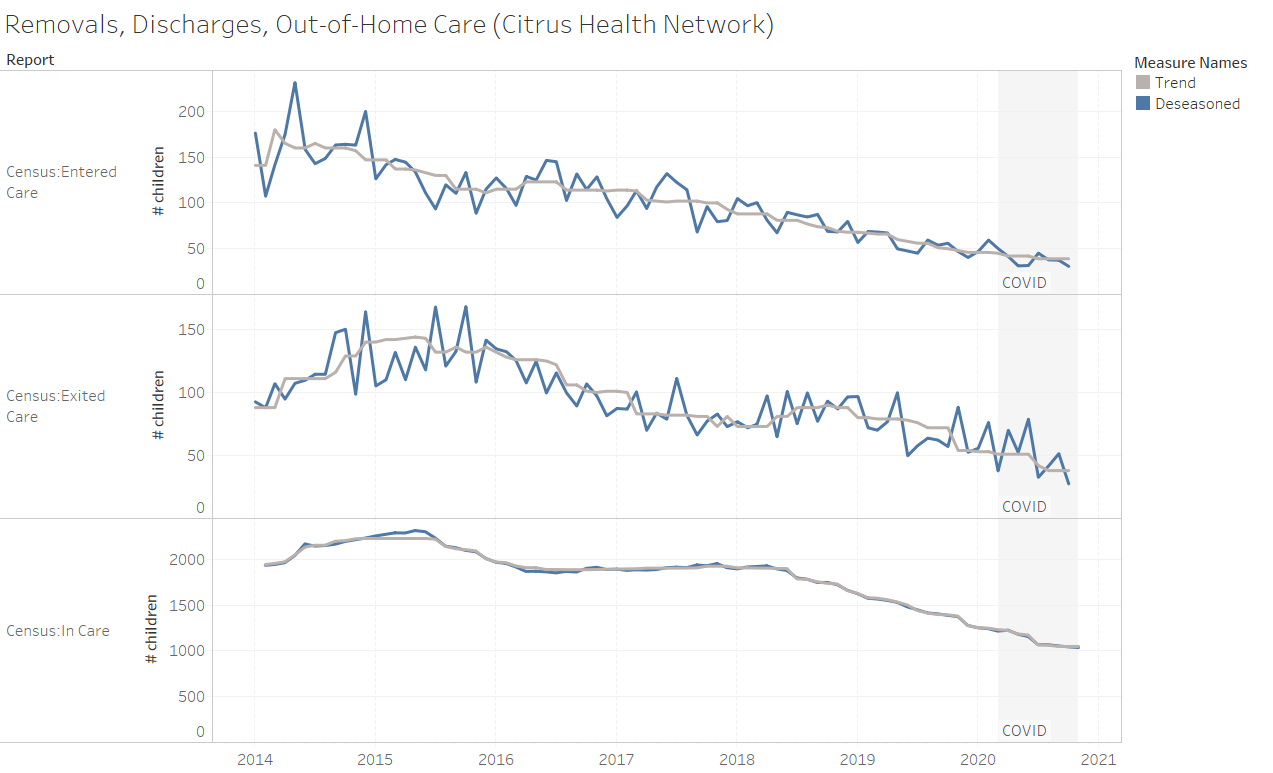
| Citrus Family Care Network | We’ve been in a contraction period for about five years, so when our removals came in low at the beginning of summer it wasn’t that unusual (they were about 10 removals under the trend, so…). The dip was mostly seen in teenagers. COVID really mucked up our discharge patterns, mostly by shifting adoptions into months we don’t normally see many of those. |
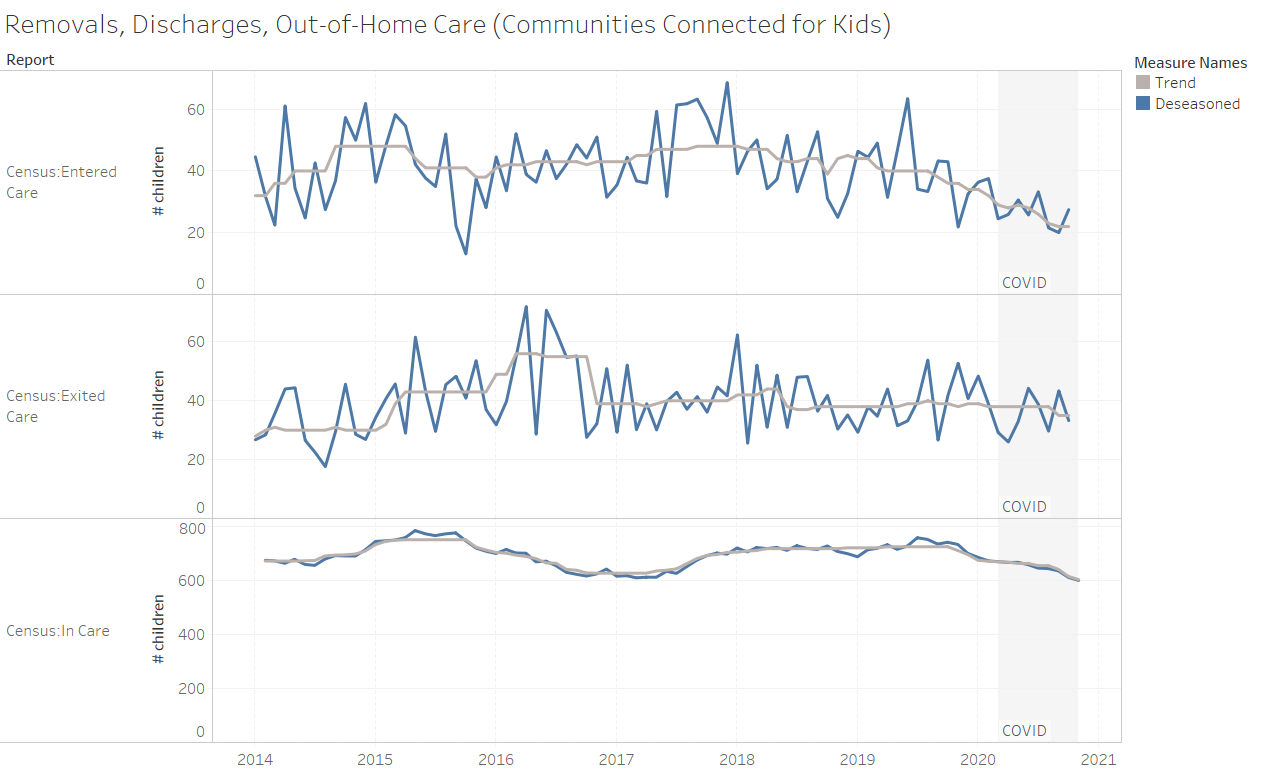
| Communities Connected for Kids | Our numbers have been going down for about a year, largely by reducing removals and keeping our discharge rate very constant. COVID didn’t really change any of that, except maybe reunifications have been experiencing starts and stops. We didn’t do any adoptions in March and they’ve been a little lower (6 per month lower) since the pandemic. On the flip side, we normally do about 1 guardianship a month and since COVID we’re up to 5. |
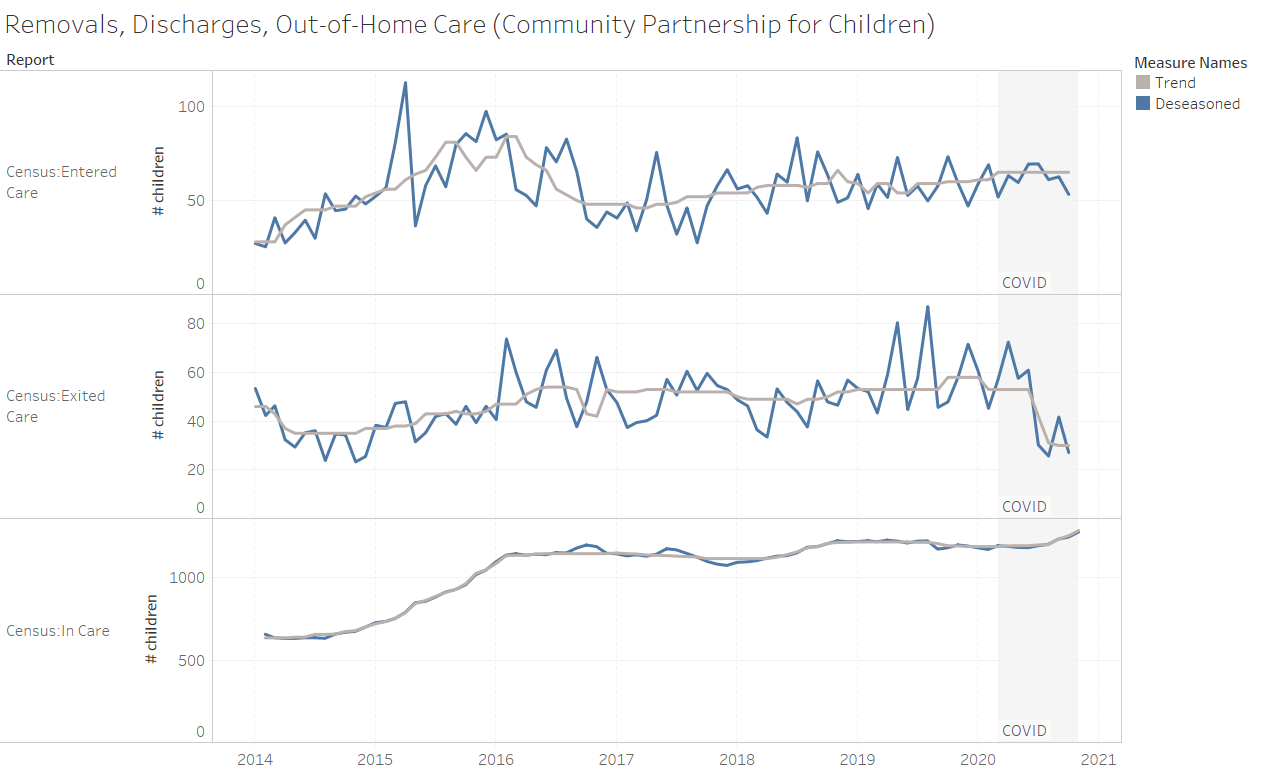
| Community Partnership for Children | We’ve had very stable out-of-home care numbers since about October 2018. Removal numbers stayed constant through COVID, but our discharge rate took a huge hit starting in July, mostly as a result of reduced guardianships and adoptions. The result was that our out-of-home care count trended up for the first time in a while. |
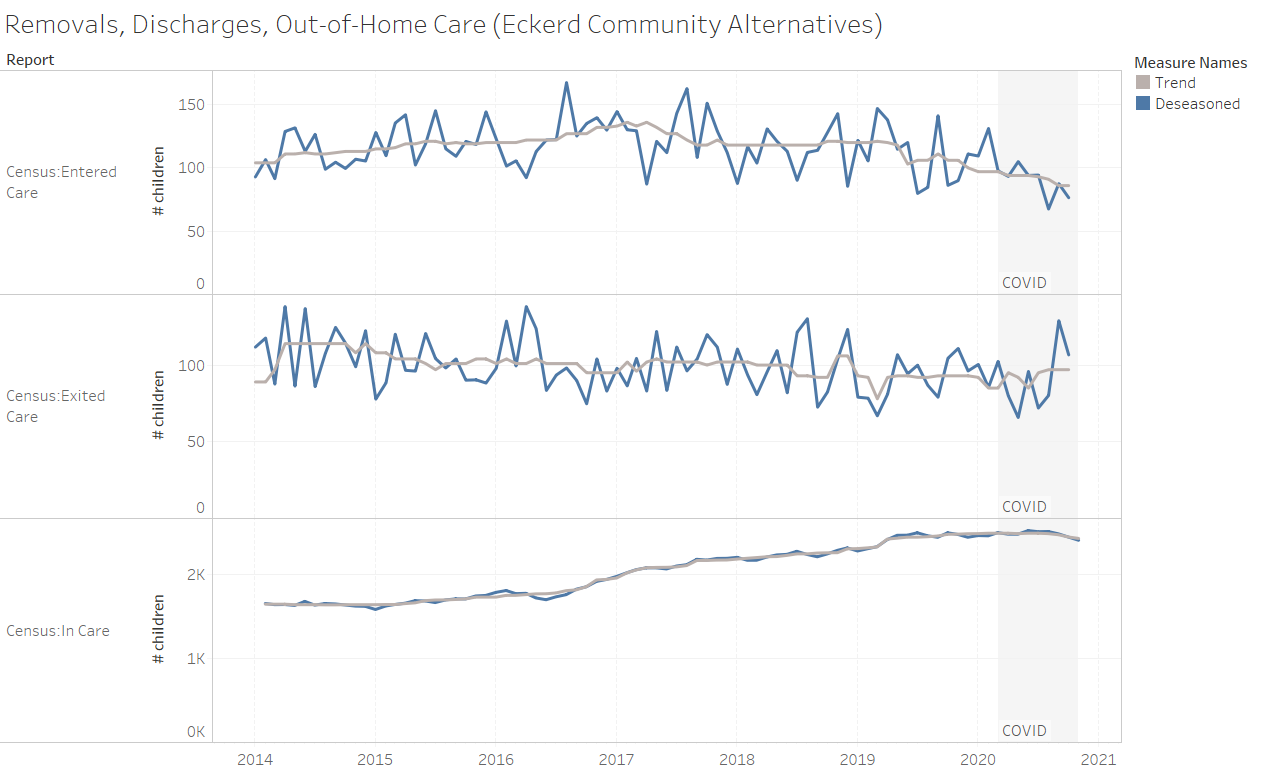
| Eckerd Community Alternatives | We have been in a very slow expansion for a long time. That was flattening out slightly before the pandemic, but COVID sped it up. Removals continued to trend down. Discharges were slower over the summer, but shot up in September and October. The result was that our out-of-home care numbers trended down for the first time in a while. |
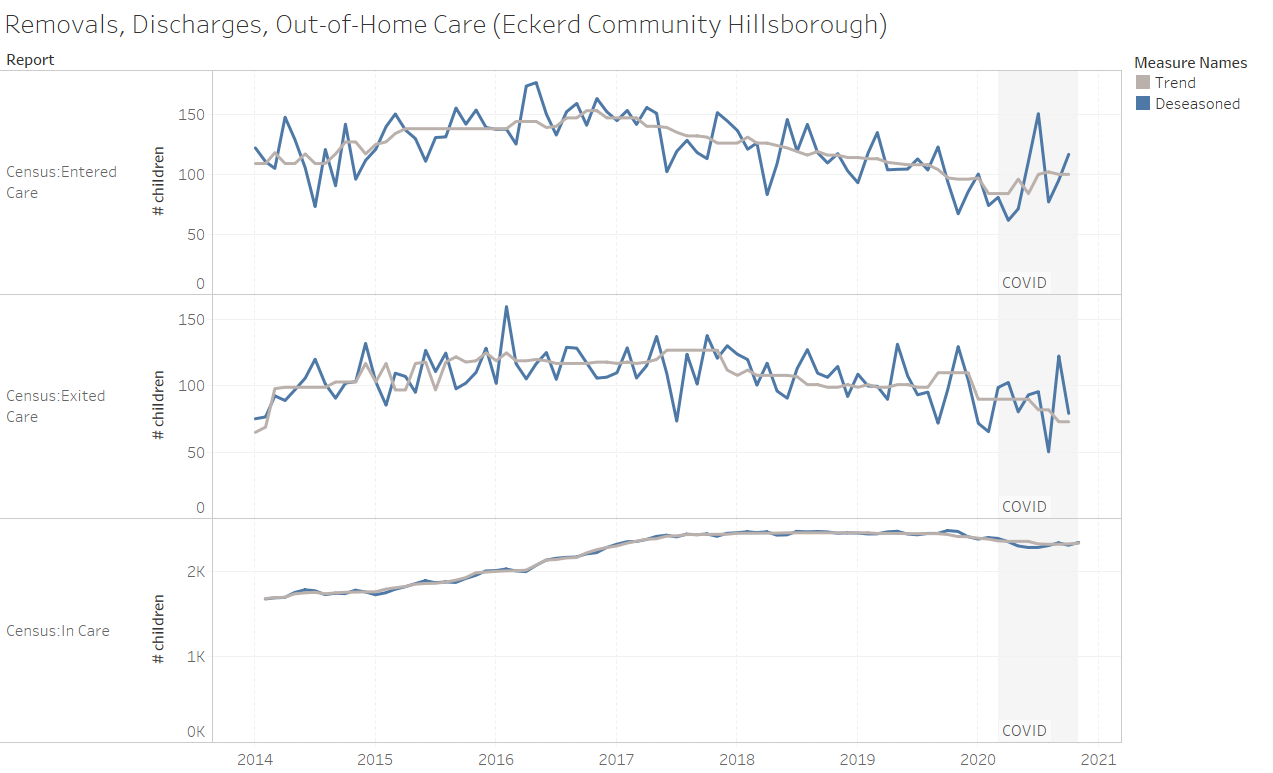
| Eckerd Community Hillsborough | After a very large expansion, our numbers have been flat since 2017. Removals had trended down for that whole time, but there was a spike in June and July during the pandemic. We’re still waiting to see if that’s a blip or changes our direction. We had a significant pause in reunifications in August, with a sharp rebound in September. Our trend line on discharges is still decreasing. |
| Embrace Florida | We’ve been in a very slow expansion for a few years now. COVID hit our removal numbers hard — down 44% in April — but then reverted back to the trendline by June. Exits have slowed very slightly. We were able to keep reunifications moving, but adoptions were a little up and down. The pandemic had almost no effect on our number of kids in care. |
| Families First Network | The pandemic took time to affect us. At first, our removals were pretty normal, a little lower at the beginning and then a little higher in the summer, but nothing out of the ordinary. Recently they dropped a lot. We’ll have to wait and see if that’s a blip. Our exits were fairly stable overall, but reunifications definitely were up and down a lot more than normal. Adoptions and guardianships were fairly normal (except that we did zero guardianships in March), but then dropped in October. Something seems to be slowing us down. |
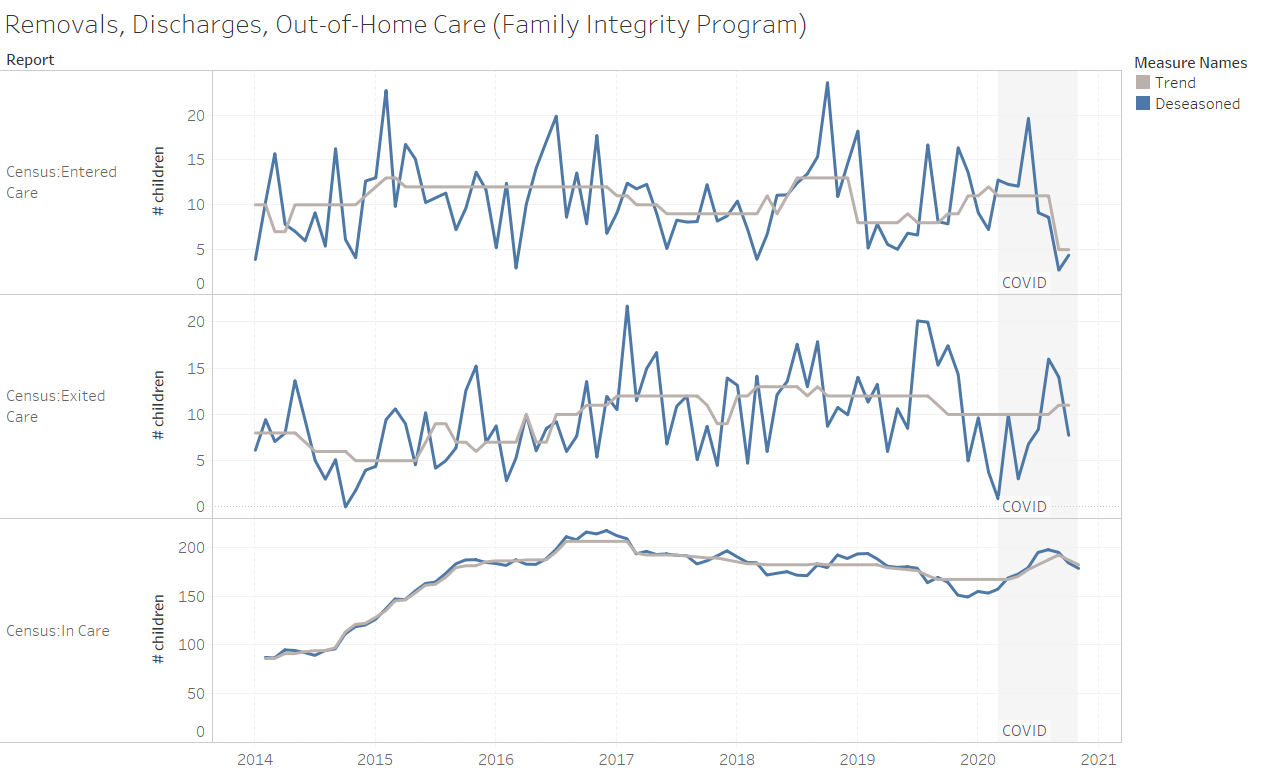
| Family Integrity Program | We’re a very small CBC, so our trendline numbers are always less stable than larger areas. We entered the pandemic on a downswing in out-of-home care population, but our numbers went back up through the summer and might even be decreasing again. Removals were pretty normal at the beginning of COVID, but dropped off significantly after a spike in June. Discharges — especially reunifications — were very slow until August and seem to have leveled off a bit. |
| Family Support Services | Our out-of-home care numbers have been stable for years, and then the pandemic hit. It didn’t affect our removals much, but discharges took a dive from about 55 per month to 36 per month. We have only rarely used guardianships since July 2017, and COVID didn’t change that (like in other areas). We reunified a lot of kids in April, but then the numbers went down. We kept our adoptions up (no surprise), but they’ve dropped slightly since August. The result is that our out-of-home care numbers are trending up for the first time in a while. |
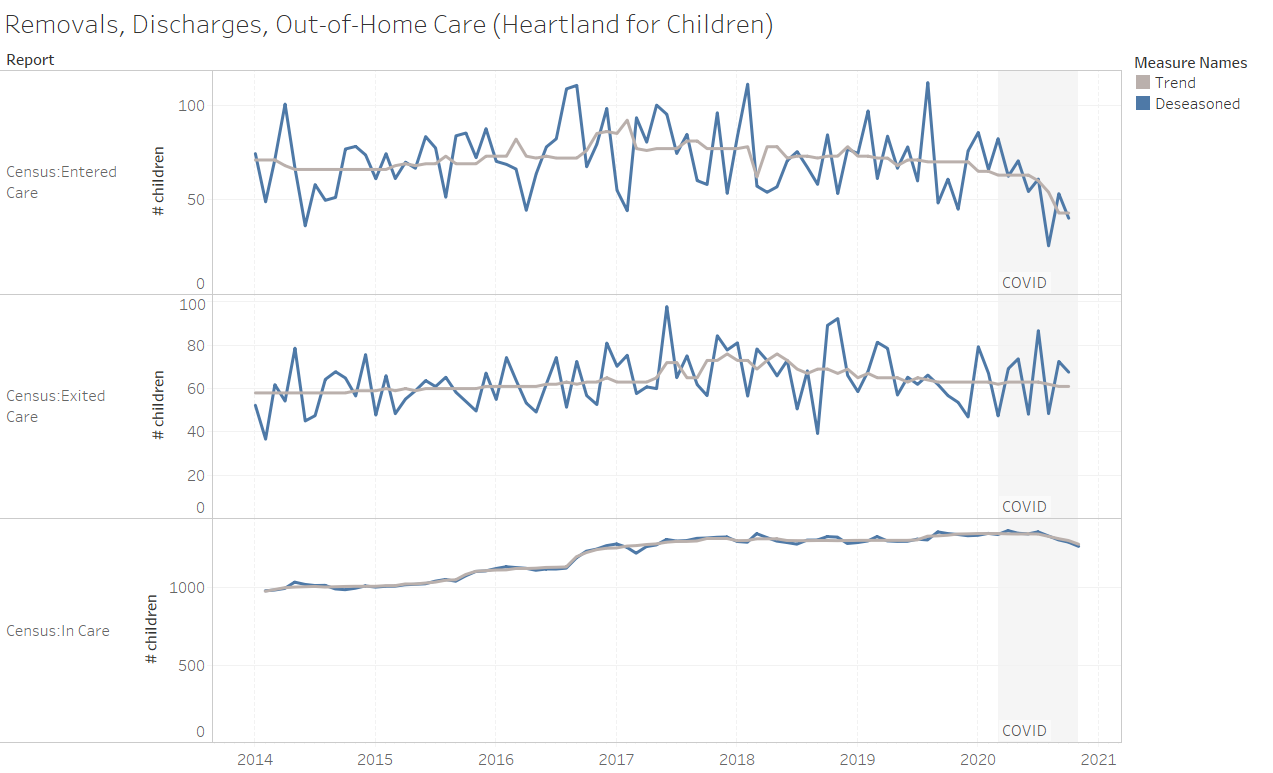
| Heartland for Children | Unlike a lot of other areas, COVID did reduce our removals from 65 per month to about 43 per month. The biggest drops were in ages 1-4 and 5-12. Our discharges became a lot more erratic, but we’ve managed to maintain our trendline of 61 per month. (We did a ton of guardianships right at the beginning of the pandemic that cleared out a lot.) As a result, our out-of-home care numbers are going down for the first time in years. |
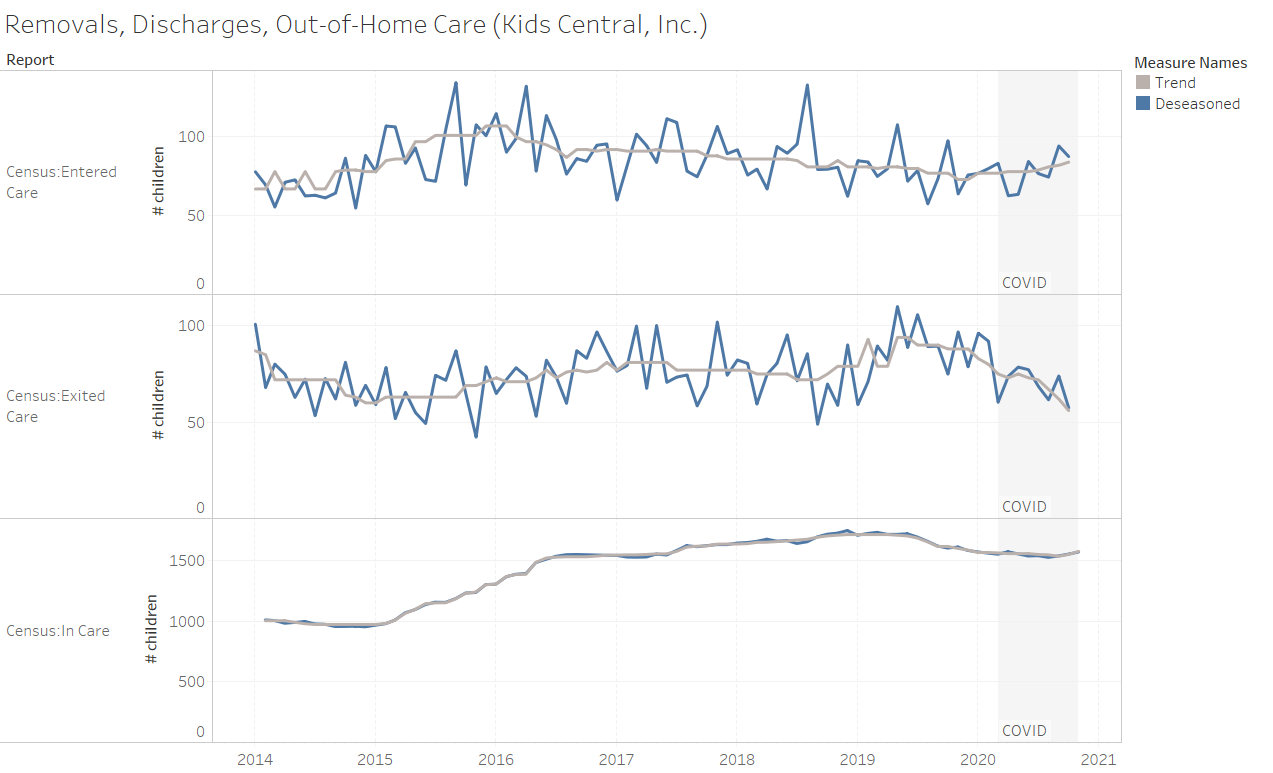
| Kids Central | We had a small contraction starting around June 2019, but it had already begun slowing due to reduced discharges. That didn’t change in COVID. What did change was our removals — they went up for the first time in a while, which means our out-of-home care numbers are going up, too. Only time will tell how permanent this is. |
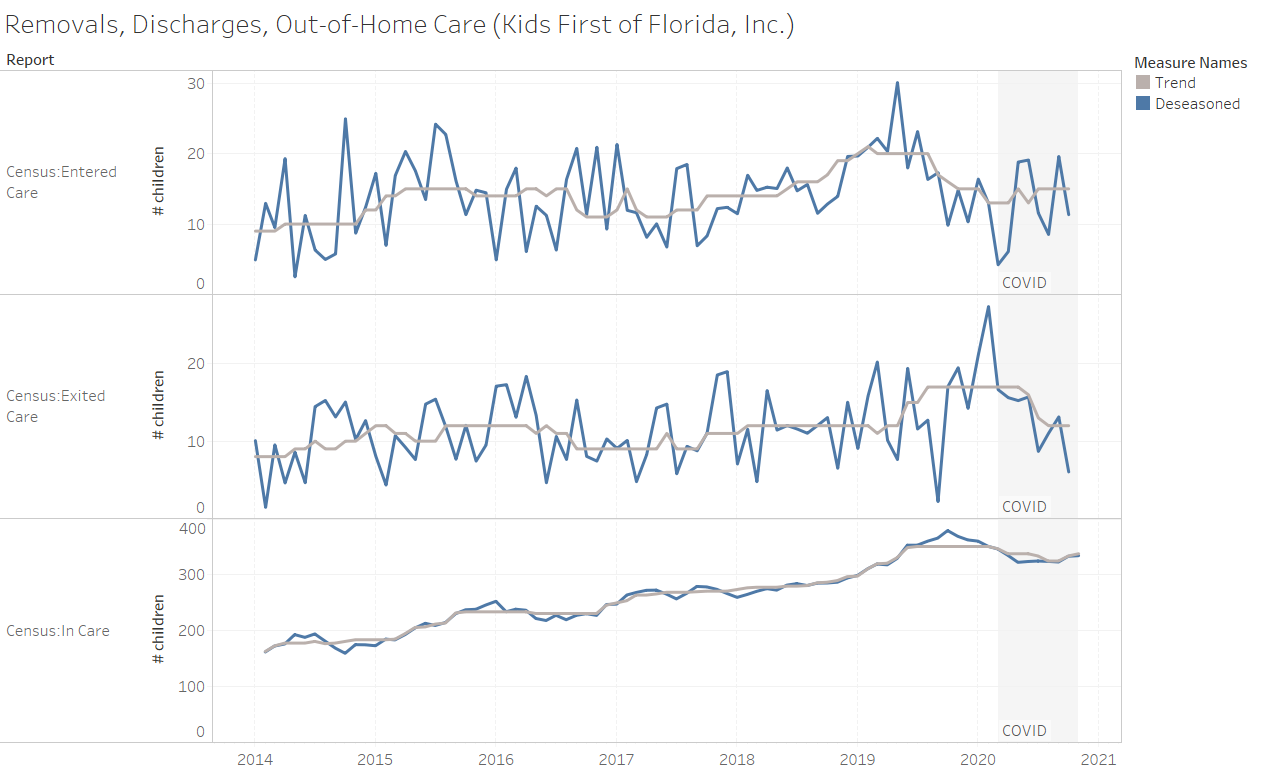
| Kids First of Florida | We are a smaller CBC, so we see a lot more movement in our trends than larger areas. We had a small expansion through 2019 that had mostly cleared out when COVID struck. Despite coming in a little low during March and April, our removal trends stayed the same at 15 per month. But, our discharges dropped from 16 per month to 12 per month. That was enough to slightly raise our out-of-home care number. Only time will tell if that’s permanent or a blip. |
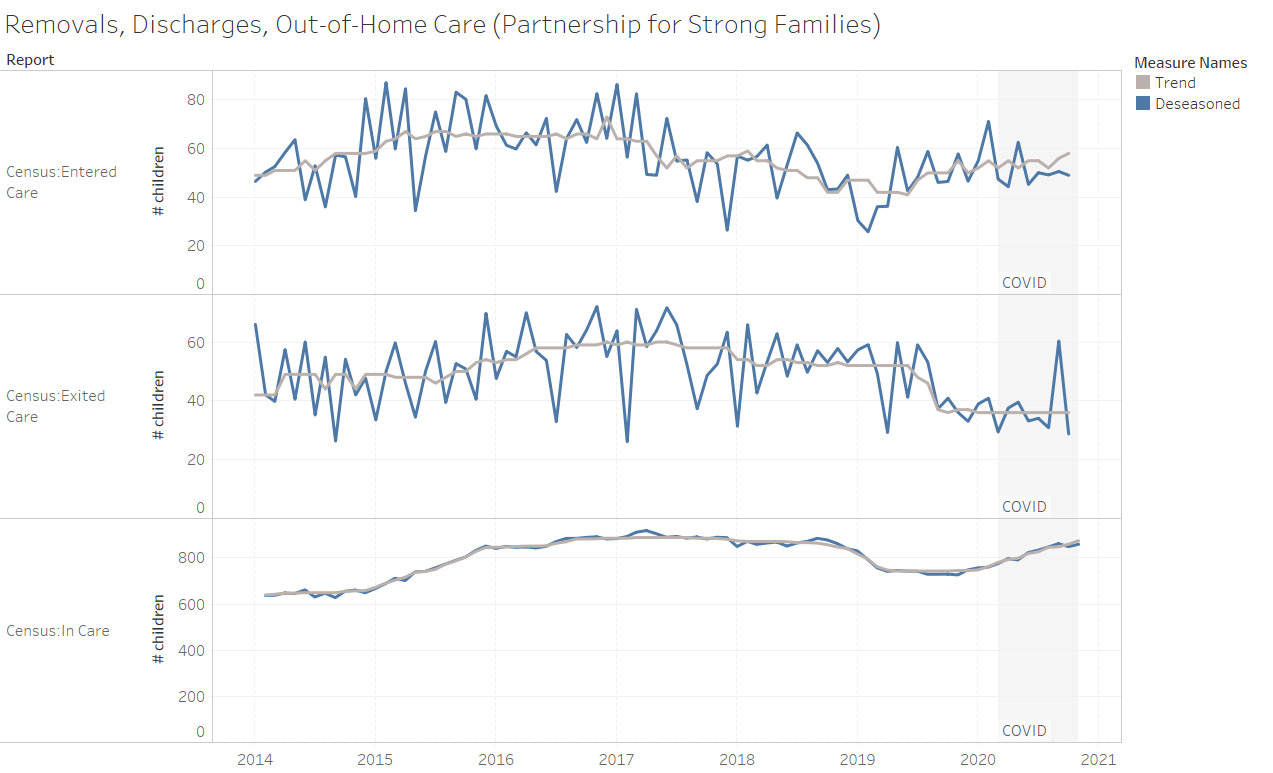
| Partnership for Strong Families | We’ve been in an expansion since 2019, largely because our discharge trend dropped a ton at the end of the year from 52 per month to 36 per month. (That had nothing to do with COVID.) Removals have trended up slightly, but really it’s the discharges that are driving our numbers right now. We cleared out 55 kids in September, mostly backlogged adoptions and guardianships, but that wasn’t enough to move the trend. |
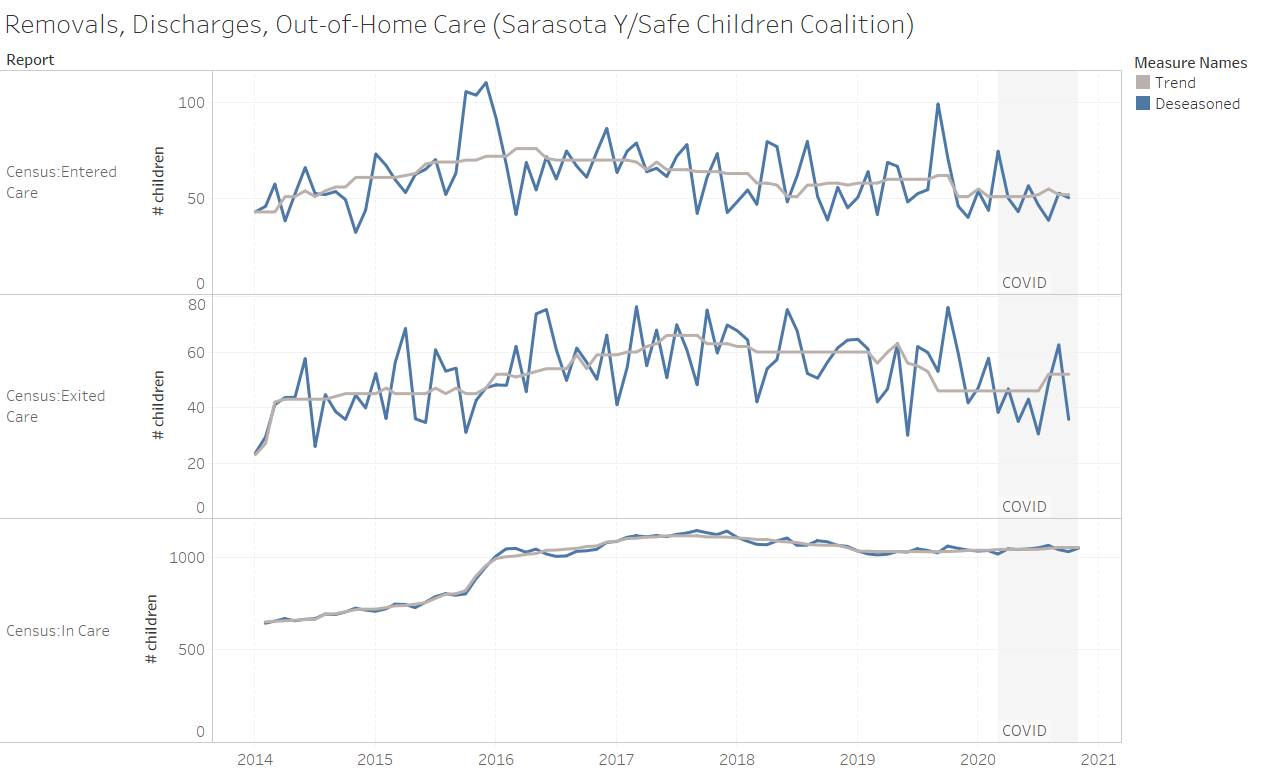
| Sarasota Y / Safe Children Coalition | Our numbers have been remarkably stable over the last four years and COVID didn’t really change that. We removed way more kids than expected in March, but removals were fairly stable after that. Discharges were somewhat low during the summer, but rose a little by Fall. Adoptions have fallen off slightly, and our reunification rate has become somewhat erratic. |
I started this post a few days ago and hoped it would be my last COVID post. But with the numbers going up and states entering back into lockdowns I’m worried I’ll be staring at these numbers for a long time to come. Be safe.
Leave a Reply