In July of this year, the Florida foster care system did something unseen since February 2014: it shrunk. For the first time in over 50 months, the year-over-year (YOY) change in out-of-home care numbers went down by 45 children. By August it was down 118, and the reports out this month for October show a contraction of 165.
While a reduction of 165 kids does not seem like much in a system with over 24,000 children in it, the slowing actually started in January 2016, when the system was growing at a staggering YOY rate of 2,540 kids. Just the month before held a YOY increase of 2,683 — the fastest growth since data is available in 2003.
There’s no official definition of a contraction period, or any way to tell if one is real or a blip. I actually sat on this post for a few months to make sure the trend was stable — we’ve had hurricanes, elections, resignations, and other unusual events recently, so I wanted to let those pass.
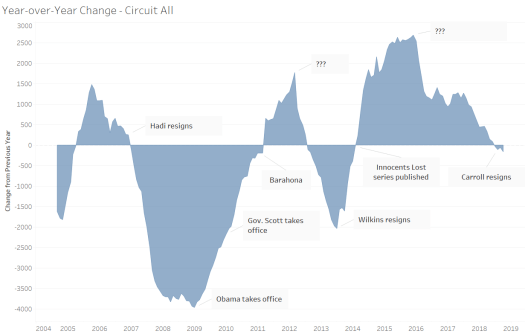
In reality, though, changes from positive to negative OOHC growth (expansions to contractions) do not happen quickly and appear largely driven by intentional policies and not outside events. The expansion under Secretary Hadi in 2004-2006 lasted 19 months and ended abruptly with the Secretary’s resignation from office in December 2006. The subsequent contraction during the Butterworth and Sheldon administrations lasted 50 months and never wavered until three months into Secretary Wilkins’ term. That change of direction occurred in March 2011, right in the middle of the public hearings and media frenzy on the Barahona case, though the contraction had been slowing since 2009 and was well on the way to reversing course even without the public outrage to speed it along. (That is, media frenzy tends to reinforce — not set — existing child welfare policy positions.)
Oddly, Secretary Wilkins’ DCF changed its expansionary course by August 2012 and entered a contraction period that continued sharply until the month that he resigned in July 2013. (I’ve never heard a good explanation for that period.) The tide immediately turned back toward expansion, continuing through Interim Secretary Jacobo and halfway through Secretary Carroll’s tenure. Growth peaked in December 2015 and then precipitously fell, flattened, and then fell again. (Note that steady growth is still growth — the chart above shows change. The charts below show the actual counts.)
Even though the system as a whole tends to move in unison, not every geographic area shifts course at the same time. The current contraction has been driven largely by sharp decreases in OOHC in three circuits — 17 (Broward), 11 (Miami), and 18 (Brevard) — which shrunk a total of 670 children over the previous year in October. The top three growth circuits — 1 (Pensacola), 7 (DeLand), 9 (Orange/Osceola) — only grew by 127 kids in all.

Decreases were clustered largely, but not exclusively, in the southern regions. Here are the changes by county.

The contractions appear driven largely by reductions in removals. (I’ve chosen to use seasonal trends below to make the changes over time more clear. The actual numbers for removals and discharges have large but regular oscillations month to month due to seasonal effects like summer and national adoption day. The raw numbers are much harder to read.)


You can see the same decreases in removals statewide. Here’s the statewide seasonal trend graph.

Here are the seasonal trend graphs for all circuits. If you notice anything interesting or know why any of these charts look the way they do, let me know.


Leave a Reply