Christopher O’Donnell and Nathaniel Lash at the Tampa Bay Times recently published an outstanding investigative piece on the harmful number of placement changes some kids experience while in foster care. They write:
Foster care is intended to be a temporary safety net for children at risk of neglect and abuse at home. Those children, many already traumatized, need love and stability to recover and thrive, child psychologists say.
But thousands of Florida’s foster children were put at risk of further psychological damage by an overburdened system that repeatedly bounced them from home to home and family to family, a Tampa Bay Times investigation found.
Times reporters analyzed more than one million child welfare records recording the movements or placements of about 280,000 foster children under Florida’s care between 2000 and 2017. They show that thousands of foster children led transient lives, many staying only a few nights in one place before being moved on to the next foster family or group home.
(Nowhere to call home: thousands of foster children move so much they risk psychological harm)
For those of us working in the system, placement instability isn’t news (many professionals are numb to it). But it is news for the rest of the world, whose picture of foster care is based on the heartstrings marketing of charitable agencies or the five o’clock stories of deaths and abuses seen in the news. The daily pains and indignities of foster care are rarely discussed by a public who doesn’t have the information or language to talk about them. I was so happy for the Times article because it gave people a new idea: many foster kids move around a lot and that’s a bad thing.
This blog has a different audience, though. The readers here know about the system, often from deep in the weeds, handling cases or overseeing agencies and programs. We have seen placements disrupt both in 30-person staffings and via unexpected text messages that our client’s been kicked out of a home we thought would last — if not forever, at least for a week. We need no emotional priming on this topic. Short of telling a child he can’t go home, the hardest thing we sometimes have to say to them is they “can’t stay there anymore.”
It’s awful. Hold on to that feeling for these next parts. I want to show you placement instability from a thousand miles up, where the people look like ants. I want to multiply that gut-wrench feeling by 17,000 to break through the numbness and help you remember that this is not okay.
The database that the Times used in its reporting is a public record in Florida. I don’t know that any newspaper had ever written a story using it before, and I commend them for doing so. I also have it. I’ve been reluctant to share it largely because it is 77.8 million data points and completely overwhelming. The article and the discussion around it, though, made me believe that it’s time.
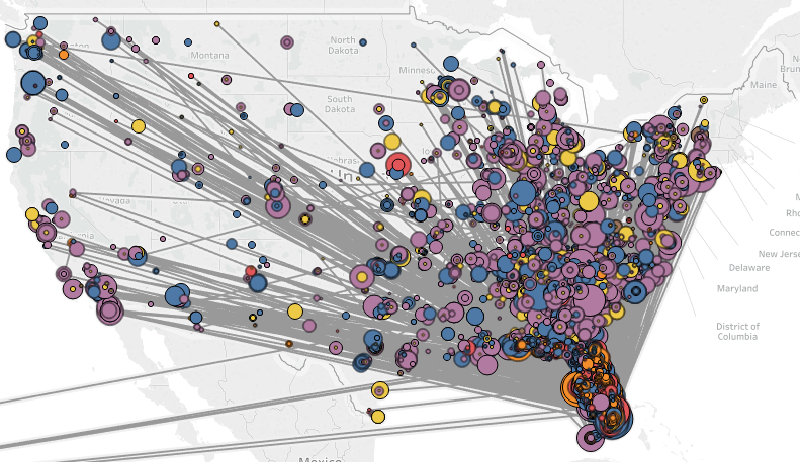
Instead of presenting the data with statistics and aggregates, I’m giving it to you how I first began to really understand it: as maps. Every dot on the map is at least one placement for a child. The colors show what type of placement: blue is foster home, purple is relative, orange is group homes, and so forth. The size of the dot shows the length of time the child spent there, and the lines show the moves from placement to placement. Sometimes there are breaks in the lines when run episodes, visitations, or administrative entries intervene. For the most part, though, it’s one continuous path from a child’s first removal placement to their last.
Here is an example. Below is the child with the second most number of placement entries in the database: 286 lines out of a million. He was removed twice: once in 2009 and once in 2011. He spent 1,211 days in institutions, 678 with relatives, 543 in group homes, and 201 on run. Only 22 days were spent in foster care. This child averaged a new placement every 9.3 days, and was moved over 3,700 miles from placement to placement, back and forth along the I-4 corridor. He had approximately 817 DCF roommates over the years and his last entry in the database was a juvenile facility in Orange County. He’s probably long gone now.

Every subsequent placement dot on the map means another “you can’t stay there anymore.” It means leaving your things behind or taking what you can carry. It means a new house with new people and rules, including other foster kids who may have already staked out their territory. You have to learn a new way to turn on a shower and hope there’s a toothbrush for you if you didn’t bring one. You get a new time to eat dinner, go to bed, and wake up — and if you don’t adjust fast enough then you might get kicked out just for that and start all over again. Imagine if you woke up with a different family every 9.3 days for years. That is not okay.
former foster youth
“I remember every one of those places.”
When I was working on this project last year, I showed a former foster youth his map. It was complicated, with lots of dots and lines crisscrossing Florida. He stared at it quietly for a while, looked up and said, “I remember every one of those places.” He asked me to print it out, and now he keeps it in a folder and takes it out when he wants people to understand what foster care was like for him.
I’m publishing the maps for 17,305 anonymized kids using Tableau. Instead of showing all 280,000 children’s maps, I’ve instead created groups of children by notable categories. For best results, I suggest opening it on a computer or tablet and hitting the full-screen button in the bottom right corner. If you’re interested in the details on each category or the database itself, there are tabs at the top of the Tableau with more information.
Below is a list of the categories you can view using the drop-down menu on the Tableau. I’ll do write-ups on them later, but I hope you will take the time to explore through the maps and imagine what life was like for the kids in these groups. It’s important to note that most kids in foster care have 3 or fewer placements and reach permanency in reasonable times. Those aren’t the kids we’re looking at here.
| 10+ Baker Acts | Hotel Kids | Shelter Dwellers |
| 10+ Correctional Placements | Incarcerated Over a Year | Substance Abuse Programs |
| 10+ Night-to-Night Placements | Institution Dwellers | Top Movers |
| Adult Jail | Longest time in care | Top Movers – No Admin |
| APD Kids | Married Out | Top Movers – Post Privatization |
| Deaths | Mom & Baby Placements | Unlikely Adoptions |
| Failed Adoptions | Most Non-relative Placements | Went to Camp |
| Failed Reunifications (<30 days) | Most Roommates | |
| Group Home Dwellers | Out-of-State Dwellers |
Before I end, there is one more map below that captures what it can mean to be in foster care. Child 310000648701 came into care on February 11, 2005. We don’t know his exact age (or his gender actually), but his placements are marked as “Traditional 0-5” foster homes. (In 2010 he makes the transition to “6-12” homes, so he has to be on the young side of 0-5 in 2005.) By the end of February, five foster parents had kicked him out. He had two placements in March, three in April, two in May, and only one in June — that one was a non-relative placement and lasted 41 days before they kicked him out, too. Then another placement for two days; then one for one day. Then he was placed with a relative who kept him for 918 days — that’s two and a half years — before the placement ended “in accordance with case plan” (which I think means pursuant to a court order) and he went back to foster care.
He bounced around some more through regular and therapeutic foster homes, landed briefly in a group home in 2010 for eight days of “respite” care, and was finally placed (in entry 42) in a non-relative placement that adopted him after 175 days.
This child had 36 placement providers and only one was a group home. Families kicked him out, again and again, and for much of that time he was under the age of five. He was with relatives for two and a half years without permanency, and then removed presumably by a judge. After six or so years, it ended in adoption, which is good. We can celebrate the adoption while simultaneously asking hard questions about his experience with 34 other families who failed to make that connection or possibly even try.

These maps tell stories that placement stability statistics cannot. Over the next few weeks I’ll share examples and more thoughts on the categories above. I hope they will have the same impact on others as they did on me.
Leave a Reply to edward opton Cancel reply