
From 1998 to 2004, Florida engaged in a massive child welfare experiment when it fully privatized not just the services in its child welfare system, but also its planning and management. Today, nineteen private community-base care lead agencies oversee the design and budgets of their respective areas. While lead agencies have changed or consolidated over the years, no exit has been as tumultuous as last week’s rollercoaster with Eckerd Connects. The meltdown was a long time coming, but that does not make the spectacle any easier to watch.
In case you missed it, this is what we know so far. Last week, DCF and Eckerd announced that Eckerd would not be renewed for the lead agency contracts in Hillsborough and Pinellas/Pasco counties when they expire. (The Pinellas/Pasco contract expires next month, and the Hillsborough contract next year.) After years of Eckerd being in the news for lacking appropriate placements, running over budget, arguably over-paying its executives, and being generally a mess, it was no surprise that DCF would finally say enough. Then the details started coming out. Something bad happened, something potentially criminal.
The initial reports that the police were involved at Eckerd’s offices were not unusual. Eckerd has been reporting the number of night-to-night kids at meetings for a while now — sometimes over 20 kids had no stable place to live and were sleeping in offices after news reporters chased them out of the Wawa parking lots. Kids often draw negative attention in professional settings. I’ve also spoken with former foster youth who say Eckerd would call the cops when they refused to go to an assigned placement even if the kid said the placement was unsafe. Police involvement was going to happen.
But this was different. The police were investigating Eckerd and its leadership for child abuse for housing the children in unsafe conditions with inappropriate supervision. There have been stories going around about a child falling off the office roof, other kids getting into prescription medication, and something about an unsecured gun. The fact that the police investigated a lead agency was stunning — removing kids from their homes and putting them into worse situations is frequently excused as a necessary evil in the child welfare system. Bad planning and resourcing are given the halo of “doing the best we can.” The sheriff in Pinellas said it’s child abuse. I think he’s right.
Eckerd’s version is different, of course. Without denying the problems, they said their board voted to give up the contract first, in a classic “you can’t fire me because I quit” maneuver. Their reason: there’s not enough money to do the job. Eckerd is a national corporation that received over $2.6 billion under the contracts since 2011, paid its national CEO around $800,000 in 2019, and reportedly overpaid its Florida child welfare program director. The question of fairness in the distribution of state funds to the lead agencies is a legitimate one, and that’s what this post is about, but the statement by Eckerd should be taken for what it is: a public relations deflection in the middle of a crisis to get us talking about anything except what Eckerd did. Kids got hurt in those offices. This collapse is going to hurt families and children who Eckerd was supposed to serve. It put hundreds of people out of work and will have ripple effects across the region and state. Eckerd was in charge and Eckerd walked away. Eckerd’s leadership are not the victims here.
The broader issue of what happened with Eckerd is also way more complicated than the press releases acknowledge. None of the problems are new, and every player in the saga had some hand in creating the mess. The sheriff, who is now saying Eckerd could be criminally liable, is the child protective investigator in Pinellas county and has been removing children (at higher than statewide average rates) and handing them to Eckerd for years despite all the known problems.
The new DCF secretary Shevaun Harris wrote that Eckerd’s ability to “fulfill its contractual duties” was in question, but that didn’t acknowledge that the previous administrations stood by while the problems grew. Actually, they did more than just stand around: the previous secretary Mike Carroll and interim secretary Rebecca Kapusta both left DCF to take leadership positions at Eckerd and an Eckerd subcontractor. If no ethics rules were broken there, then the rules should probably change.
There were also other oversight mechanisms that should look hard at how they responded to this meltdown. If Eckerd was doing a poor job, the courts had the power to deny shelter petitions, place kids in the custody of relatives and nonrelatives, and hold DCF and Eckerd accountable for failing to meet the needs of kids. The foster parent association went public saying that Eckerd would lie to them about the severity of needs of kids, but that excuse only works once or twice — Hillsborough had one of the highest rates in the state for providers requesting children be removed from their homes. The Guardian ad Litem Program exists in all three counties but its public statements over the last year have been about recruiting volunteers and clothing drives. Important things, but what did they do to address the systemic issues?
And attorneys for the citizens wrapped up in this mess should look hard at their (our) actions, too. Parents’ attorneys should examine their role in fighting to improve the conditions of their clients’ children, and children’s attorneys should think about whether the strategies they (we) used were appropriate for the scale of the problem at hand. Apparently not.
All of that should be part of a review later. For now, let’s indulge Eckerd’s main contention that it did not get enough money to do the job well. The short version: there are about 15 lead agencies who all wish there was more funding and probably still think that’s some bullshit.
Privatization in General
First, a quick word on privatization. The government contracting of services is nothing new, nor are public monopolies on utilities and other highly sensitive industries. Child welfare services such as therapy and facility placements have long been contracted by the state from private actors. Many of those institutions, in the form of religious charities, boarding houses and orphanages, historically predate the modern government-run system.
Researchers into privatization have identified factors that lead to its success: vendor availability, market competitiveness, certain characteristics of the services themselves, and the ability of the government to monitor and enforce its contracts. Contracting for therapists, for example, makes sense: there are lots of them already competing for customers in the market, and we can set clear measures of performance and maybe even outcomes. The government can easily monitor a contract with a therapist — either they did or didn’t do the session, and either the client did or didn’t benefit from the service after a certain amount of time. Through the contract monitoring process, the state retains a level of control over the service.
Florida has done something very different, though. Florida contracted out the program planning and contract monitoring to agencies that then contract out the services. A 2011 study goes through the tortured history of privatization and the efforts to monitor it both in-house at the Department and through various failed third-party monitors. The early years of community based care should have been a clue as to how it would unfold. There were not enough available vendors in the market to run entire regions, there was no true competitiveness among the vendors because running one large region was generally more than anyone could handle, and it’s hard to define “success” in the system and even harder to monitor agency compliance with the most important measures (especially when the Department keeps gutting its contract oversight unit). The conclusion is that Florida keeps trying to hollow out its government involvement with child welfare, but failure keeps dragging it back in.
The primary principle of a market system is that you get what you pay for. Florida pays for child welfare in a very specific way that has nothing to do with quality.
The Equity Funding Model
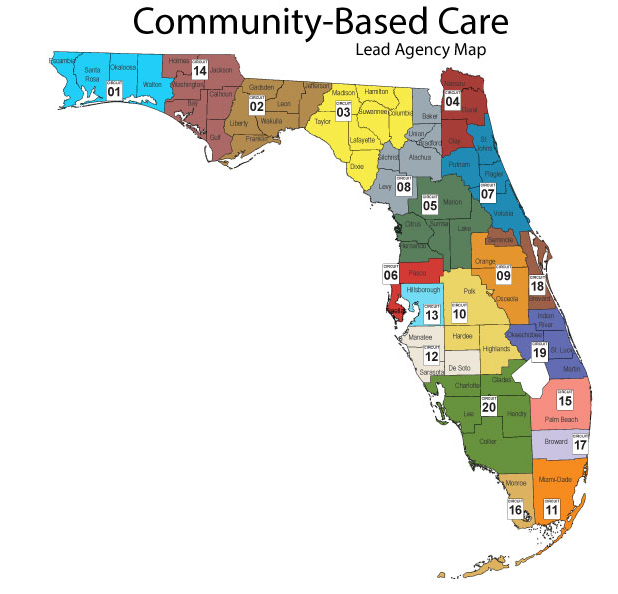
There are lots of funding streams that go into the child welfare system. Federal, state, and local dollars mix with grants and donations to create a billion-dollar industry. In a typical state-run system, the statewide agency has a lot of control over its budget to respond to problems when and where they arise. In our privatized system, the Department receives a grant of general revenue from the legislature and then apportions the money among the 19 lead agencies. Once apportioned, those amounts are tied up in statutes, regulations, and contracts. The lead agencies have a private right to enforce those agreements in ways that a regional director in a state-run system would not.
In order to provide predictability in the apportionment, Florida uses an equity allocation model. The model, a mathematical formula, determines what a lead agency’s share of the state money should be based on certain factors. To provide stability to the agencies, which can hold the contracts for decades, the model also includes a throttle mechanism so the allocations change gradually over time. To buffer against sharp changes in local circumstances, there is a risk pool that DCF can also quickly authorize funds from as needed. Finally, an agency can go straight to the legislature to ask for funds or changes in policies to address deficits. This creates rent-seeking behaviors among the regional agencies, effectively state monopolies, that rely more on political connection than planned management.
The legislature has taken control over the funding of the individual agencies. Originally set by DCF, the equity model was then spelled out in legislative budget proviso language, and now is in statute. This codification makes it even harder to adjust to changing conditions. DCF is essentially a pass-through that can, as it did with Eckerd, terminate or not renew a contract, but with little other direct power to control the resources or management of any particular agency.
In the chart below, you can see how priorities in the equity model have shifted over time. In 2010, the formula equally weighed each agency’s children in poverty, children with abuse calls, and children in care at 30% each. It also weighed the agency’s ability to reduce the number of kids in care (10%). Compare that to the current statutory formula as of 2018, which prioritizes the number of children under DCF supervision (60%), the workload of the hotline (35%), and the number of children in the area (5%). To stabilize the allocation over time, the formula starts with recurring funding and then provides new funds to agencies, setting aside 30% to raise agencies that are below their equitable share.

Eckerd has often pointed to the lead agency in Miami as proof that it is being underfunded, and it did so again last week. But looking at the number of kids in each system gives a clue at how the two agencies’ experiences differed. Back in 2007, Hillsborough had nearly 3,200 kids in out-of-home care; Miami had over 2,700; and Pinellas/Pasco had 2,300. During that period when the state was pushing to reduce the number of kids, all three regions did so. Then in 2011, the direction of the system changed statewide with an expansion that began under Rick Scott. All three regions saw an increase. Under the equitable share formula, agencies no longer benefited from the reduction-in-kids bonus, and it was scrapped in 2015.

Under the 2015 formula, the number of children in care weighed heavily (80%). Miami’s numbers were comparatively high then, so they benefited in the formula from that change, only to see their share reduced as their number of kids in care flattened in 2016. Eckerd’s share of kids kept rising, though, which would have helped it in the formula (albeit throttled). In 2018, with a stronger emphasis on prevention, the formula changed again to weigh kids under investigation somewhat more heavily. Miami focused on keeping kids out of care and reduced its case loads by nearly half. Eckerd’s regions kept growing, but the increased numbers were worth less in the formula.
How should a system be funded if it’s managing to reduce the number of kids in care? Should Miami get half as much funding, or is the current funding level the right amount to keep its numbers down? The formula addresses that question in a very specific way because it doesn’t look at the number of kids in care. It looks at the proportion of kids a lead agency handles in the state. So, if an agency holds its numbers steady while every other CBC increases theirs, that agency will lose money in the formula. There is no incentive to be the first agency to lower the numbers; but that’s what Miami did, and was able to in part because it negotiated a higher rate at the beginning of privatization that gave it room to ride the algorithm down without significant disruption (at least that’s what the oral history of Miami’s system says — I wasn’t there and would love to hear from someone who was). There is, however, an incentive to be the first to raise your numbers in a given category and capture a higher proportion before the other agencies catch up. This could be a good or bad thing depending on the category and the cost of care for that group.
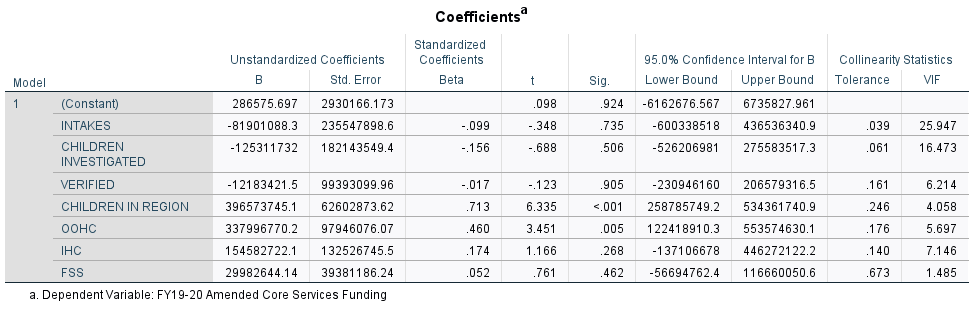
I couldn’t find a published report on the agencies’ equity shares, so I pulled the measures in the formula from the DCF dashboards for FY19-20 and plugged them in. This is what I got.

Let’s start by looking at the factors that go into the equity share calculation to see if they’re even meaningful. The numbers show that the formula could be simplified slightly. The number of intake calls to the hotline is so highly correlated with the other inputs that it may be equivalent to double-counting.

When taking into account all the correlations, the most important factor is definitely the number of children in out-of-home care, followed by the number of children in family support services, children in the region, and children with verified findings. The number of intakes barely registers.

Comparing the equity score to the number of children served below, we can see that the score tracks system size pretty well. System size (out-of-home care, in-home care, and family support services) alone could account for about 98% of the difference seen, and the hotline workload factors alone could account for 94%. When we’re talking about such large amounts of money, though, even the remaining 2-6% can be tens of millions of dollars.
There are a few agencies that score higher than their system size would predict. An equal proportion for each measure would be 1/19 or about 5.2% each. Family Support Services comes in higher than its size in large part due to having a greater number of kids in family support services compared to everyone else (12%, which is only 74 children). The same is true for Citrus in Miami, but Citrus also has a lot of children in its region (13%). Embrace Families is a little higher due to having a lot of investigations in their area (11%). On the other side of the line, ChildNet Broward has very low family support services numbers (0.9%), which drags its equity amount down. Again, raising numbers first or getting left behind the pack is the strongest way to affect the equity value.

None of this tells us what a system would actually take to run effectively. Because of the throttling mechanisms, risk pool, and outside funding, the actual funding may look very different from what the formula predicts. We look at that next.
Actual Funding
DCF conducted a comprehensive review of the lead agencies’ finances in November 2020. The chart from the report below shows that Pinellas/Pasco has consistently received the same or higher core services funding each year (the risk pool and back of the bill funding for FY20-21 is not yet included in this report). Over the years it has also received $22 million injections of funding from the risk pool and the legislature outside of the equity formula, half of which was in FY19-20.

Hillsborough, meanwhile, also received more each year with nearly $14 million in extra funding.

For comparison, below is Miami/Monroe. It received about 21% more than Hillsborough and never had to dip into the risk pool or legislative funding sources.

The equity system is designed to use core services funding, risk pool, “back of the bill” funding, and other amendments to respond to real situations, so I think the “Amended Core Services Funding” is the right comparison measure to see how the system is working. The input measures to the equity formula account for about 94% of the differences we see in the actual funding. Again, that remaining 6% is upwards of $42 million.
The only two inputs that really matter in predicting actual funding is the size of the region and the number of kids in out-of-home care. This shows the gap between the aspirational equity formula and reality. Bigger regions get funded more, with some exceptions.

Those exceptions are important. Comparing Amended Core Services Funding to the number of children served, we can see that Eckerd’s leadership is correct that Miami and to a lesser extent Broward are funded higher than the equity share or their size would predict. But we can also see that these two are outliers for a very clear reason. I’ve included two extra dots to show where Miami and Broward would fall if they kept their 2015 numbers steady over time. Miami would have been right on the trend line. Broward would be low. Miami’s funding poses an important question, but not the one Eckerd wants it to.

Maybe all agencies should be funded at the same per-child rate as Miami (high) or Heartland for Children (low); maybe agencies that reduce their size should get less money or more money or the same amount of money; maybe funding should grow faster as systems get bigger to account for increasing system complexity; or maybe there is just a maximum size of a lead agency beyond which things are no longer sustainable. All of those are possible, but the question is why Eckerd was unable to do the job with essentially the same or more funding as most everyone else. Maybe seeing what they spent the money on will help.
Expenditures
Below is the FY19-20 expenditure per child on core services, also from DCF’s comprehensive report. On average, lead agencies spent the most on case management, followed by facility-based placements, foster homes, and then prevention, client, and adoption recruitment services. Training and the newly established Level I licenses are last.
The box-and-whisker charts show the distribution of spending per child in that system. Each dot is a lead agency, but I’ve only highlighted four — Hillsborough (green), Pinellas/Pasco (blue), Miami (red), and Community Partnership (yellow). Each box is shaded light and dark, marking 25% above and below the median for that measure. The whiskers on each end of the box show the edges of the distribution, and anything beyond them is an outlier.


You can see there were notable differences by agency. Miami (in red), with its outlier amount of funding, also had an outlier amount of spending per child on case management, foster homes, client services, and training. It spent a high-normal amount on adoption recruitment, and was right in the middle on group homes.
Eckerd Hillsborough (in green), meanwhile, spent a fairly average amount per child on case management, foster homes, and client services, but a high amount on group homes and a low amount on prevention and adoption recruitment. Pinellas/Pasco (in blue) spent a very low amount per child on case management and adoption recruitment and a very high amount on group homes.
Community Partnership for Children (in yellow), on the other hand, was working from a more significant deficit below average. It spent the least per child on case management, a normal amount on group homes, and was in the low average on everything else.
If you want that broken down by system size, here are the categories. You can mentally move the Miami and Broward dots to their 2015 sizes of 3,960 and 3,479 respectively.
Case Management: Clearly linear, with Citrus as an outlier. Eckerd Pinellas/Pasco spent on the low side compared to its size.

Facility Care: Clearly linear with some spread in the middle. Eckerd spent on the high side.

Foster Care: Also linear, but with outliers. Eckerd is pretty average here.

Prevention: Loosely linear with a very wide spread in the middle. There’s a lot more variation here unrelated to system size. Pinellas/Pasco is high, but Hillsborough is very low.

Administrative Overhead: Linear, but with some spread in the middle. Eckerd is high.

What does it mean?
Eckerd’s implosion raises serious questions about our model of privatized planning and management. We need this discussion, because Eckerd will not be the last agency to go under. Part of that discussion should include structural questions around whether we should have lead agencies at all, whether they should have capped sizes, and what guiderails should be put on their spending decisions. There could also be questions around how we reward and punish certain system-wide measures like increasing or reducing the size, having sufficient placement capacity, and prioritizing family over facility-based care. There should also be a discussion about why the funding formula doesn’t even try to reward better outcomes or quality. Is that because we can’t measure quality? Or because we don’t think outcome goals are actually attainable?
Eckerd’s contention that funding limited their options should not be entertained by anyone. Agencies with similar or less funding did not house children in offices with inappropriate supervision. Eckerd made policy choices, and the results were catastrophic.
Leave a Reply